Fig. 8
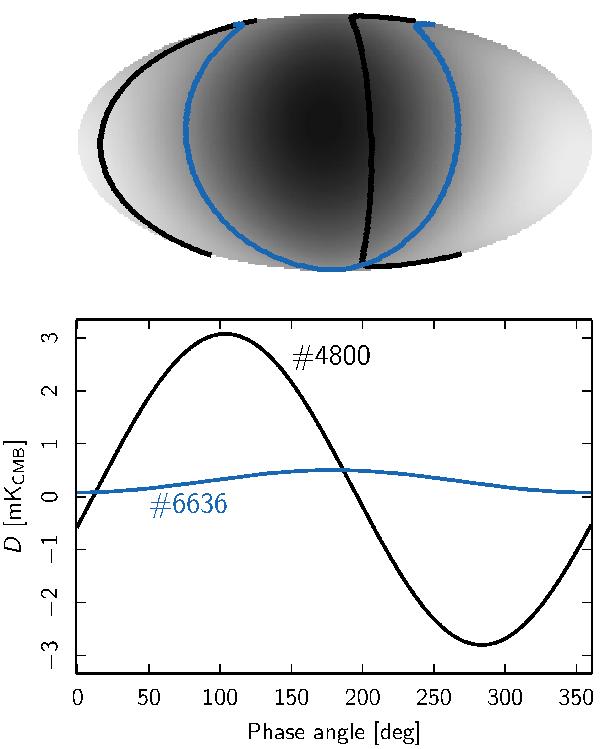
Top: dipole signal due to the motion of the solar system only (in Ecliptic coordinates). The points observed by LFI27M during pointing periods 4800 (250 days after launch) and 6636 (300 days) are shown with black and blue lines, respectively. (In Fig. 5, panel B on the right, we indicate the times when these two periods occurred with black dots.) Bottom: dipole signal along the same two pointing periods as a function of the North phase angle. Note the difference in the amplitude of the two sinusoidal waves. Such differences are due to the Planck’s scanning strategy and determine the statistical error in the estimation of the calibration constant K = G-1 (Eq. (1)). Refer also to Fig. 9 for details about how K is computed for these two pointing periods.
Current usage metrics show cumulative count of Article Views (full-text article views including HTML views, PDF and ePub downloads, according to the available data) and Abstracts Views on Vision4Press platform.
Data correspond to usage on the plateform after 2015. The current usage metrics is available 48-96 hours after online publication and is updated daily on week days.
Initial download of the metrics may take a while.