Fig. 5
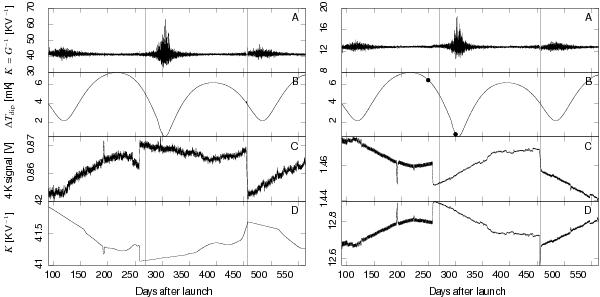
Variation in time of a few quantities relevant for calibration, for radiometer LFI21M (70 GHz, left) and LFI27M (30 GHz, right). Vertical dashed lines mark boundaries between complete sky surveys. All temperatures are thermodynamic. Panel A): calibration constant K estimated using the expected amplitude of the CMB dipole. Note that the uncertainty associated with the estimate changes with time, according to the amplitude of the dipole as seen in each ring. Panel B): expected peak-to-peak difference of the dipole signal. The shape of the curve depends on the scanning strategy of Planck (see also Fig. 8), and it is strongly correlated with the uncertainty in the gain constant (see panel A)). The two dots indicate at which time the data used to produce the plots in Fig. 9 were taken. Panel C): 4 K total-power output voltages V. Note that the noise level for V is much more stable than it is for K, as it does not depend on the dipole amplitude. (All the large jumps seen in this figure occurred because of some change in the operational state of the spacecraft; e.g., 456 days after launch we switched off the primary 20 K sorption cooler and turned on the redundant unit.) Panel D): The calibration constants K used to actually calibrate the data for this Planck data release are either derived by applying a smoothing filter to the raw gains in panel A) (70 and 44 GHz, e.g., LFI21M, left), as described in Sect. 3.1, or through Eq. (32) and the 4 K total-power voltages in panel C (30 GHz, e.g., LFI27M, right).
Current usage metrics show cumulative count of Article Views (full-text article views including HTML views, PDF and ePub downloads, according to the available data) and Abstracts Views on Vision4Press platform.
Data correspond to usage on the plateform after 2015. The current usage metrics is available 48-96 hours after online publication and is updated daily on week days.
Initial download of the metrics may take a while.