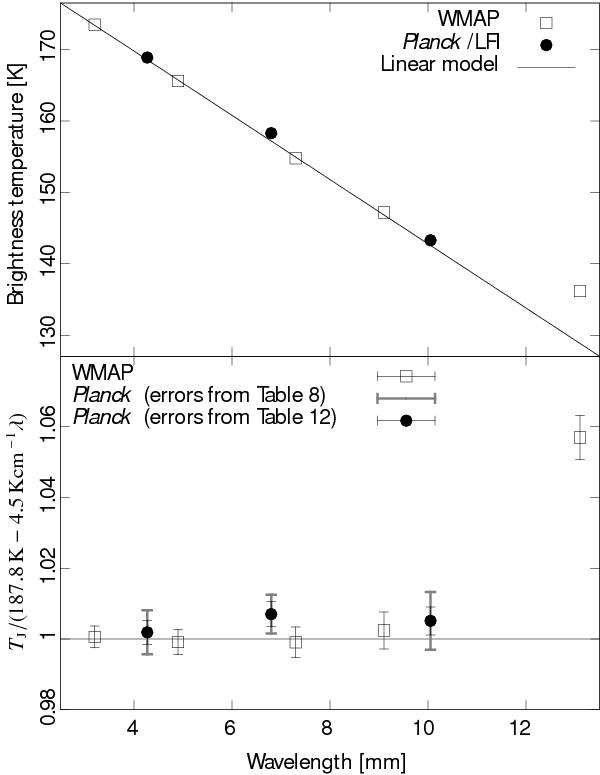
Fig. 23

Jupiter spectrum for LFI compared to the WMAP spectrum (Weiland et al. 2011). Planck data are taken from Table 12. (The LFI points have been rescaled by a factor, 1.0693, which takes Jupiter’s oblateness into account, in order to make them easier to compare with WMAP’s.) The upper frame shows the brightness temperatures as a function of the central wavelength, alongside a simple linear model TJ(λ) = 187.8 K − 4.5 K cm-1λ, which by construction passes through the WMAP’s points at λ = 3.2 mm and λ = 9.1 mm. For both Planck and WMAP, measurement errors are smaller than the size of the symbols. In the bottom frame, we rescaled our points to the linear model in order to better show deviations from it. The error bars for LFI data show the uncertainties quoted in Table 12, as well as the overall calibration errors listed in Table 8.
Current usage metrics show cumulative count of Article Views (full-text article views including HTML views, PDF and ePub downloads, according to the available data) and Abstracts Views on Vision4Press platform.
Data correspond to usage on the plateform after 2015. The current usage metrics is available 48-96 hours after online publication and is updated daily on week days.
Initial download of the metrics may take a while.


