Fig. 22
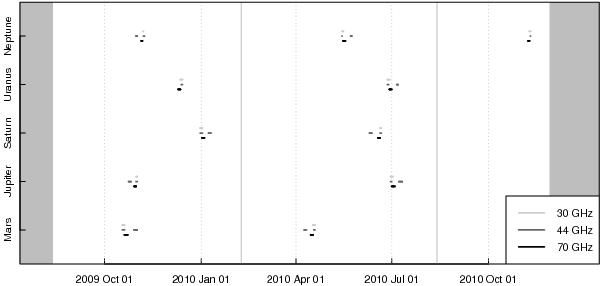
Timeline of planet crossings. Each line shows the times when the planet fell within the beam of at least one of the radiometers at 30, 44, or 70 GHz. Grey bands at the edges mark the start of the survey and the end of the period considered in the 2013 data release. Vertical grey lines mark the separation between sky surveys.
Current usage metrics show cumulative count of Article Views (full-text article views including HTML views, PDF and ePub downloads, according to the available data) and Abstracts Views on Vision4Press platform.
Data correspond to usage on the plateform after 2015. The current usage metrics is available 48-96 hours after online publication and is updated daily on week days.
Initial download of the metrics may take a while.