Fig. 21
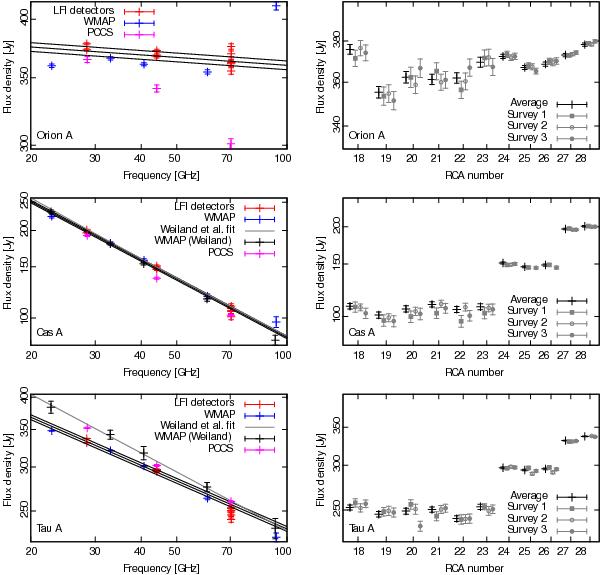
Spectra (left) and per-survey and per-RCA measurements (right) for Orion A (top), Cas A (middle) and Tau A (bottom). For the spectra, the flux densities measured using aperture photometry are shown for LFI and WMAP, as well as the best-fitting power-law to the measurements (solid line) and a ±1% range (dotted line). The fit and data points from Weiland et al. (2011) are shown for Cas A and Orion A, and the Planck Catalogue of Compact Sources (PCCS) flux densities for all three sources are shown. For the per-RCA measurements, RCAs 18−23 are at 70 GHz, 24−26 at 44 GHz and 27−28 at 30 GHz. For each RCA, the average from the three surveys is shown, followed by the measurements from each survey.
Current usage metrics show cumulative count of Article Views (full-text article views including HTML views, PDF and ePub downloads, according to the available data) and Abstracts Views on Vision4Press platform.
Data correspond to usage on the plateform after 2015. The current usage metrics is available 48-96 hours after online publication and is updated daily on week days.
Initial download of the metrics may take a while.