Fig. 19
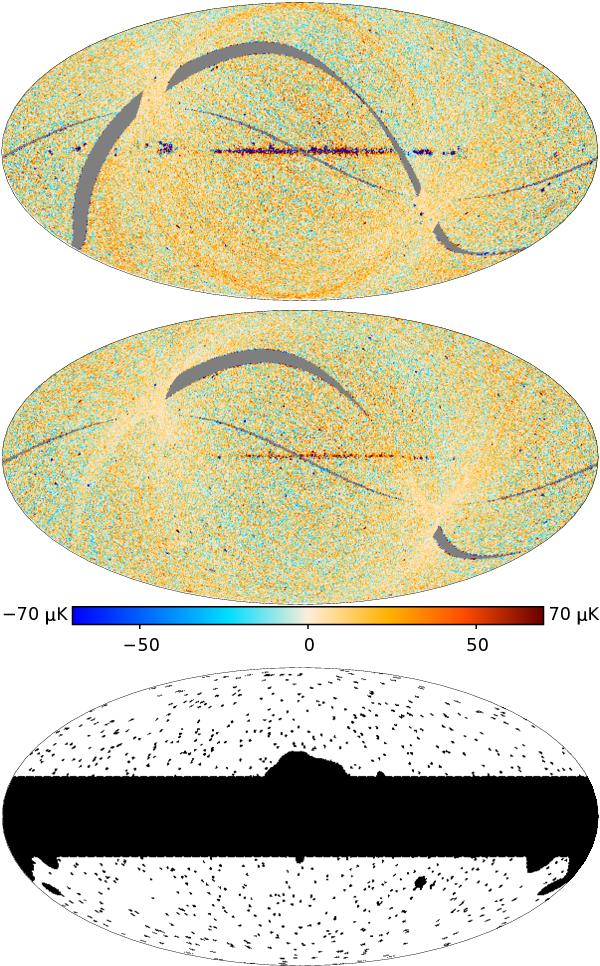
Survey difference maps at 30 GHz. Top: difference between survey 1 and 2. Middle: difference between survey 1 and 3. Note that the 1−2 difference map has sharper features, due to the different scanning strategy between odd and even surveys that prevents optical systematics from being cancelled in the subtraction. Bottom: the mask used to distinguish between CMB-dominated regions and Galactic regions when computing the numbers reported in Table 8 (30 GHz case).

Current usage metrics show cumulative count of Article Views (full-text article views including HTML views, PDF and ePub downloads, according to the available data) and Abstracts Views on Vision4Press platform.
Data correspond to usage on the plateform after 2015. The current usage metrics is available 48-96 hours after online publication and is updated daily on week days.
Initial download of the metrics may take a while.