Fig. 15
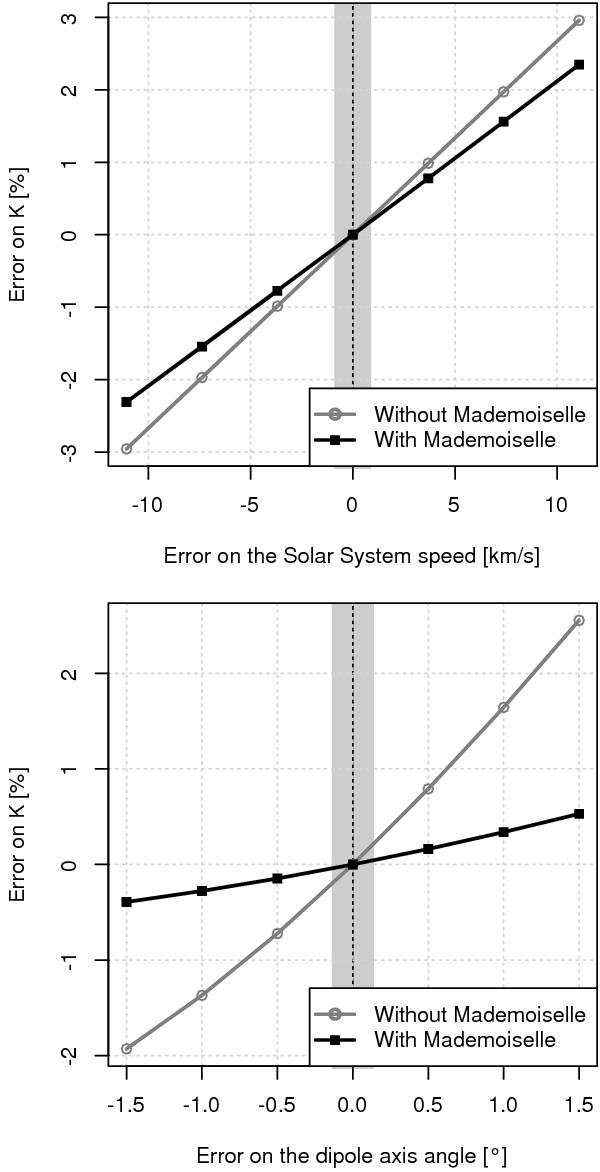
Variation in the average level of the calibration constants of LFI27M, with (black line) or without (grey line) applying the Mademoiselle iterative code, as a function of the error in the solar system speed (top) and the displacement of the dipole axis (bottom). The two plots are normalized so that all the lines go through the point (0,0). The width of the vertical grey band corresponds to the error quoted by Jarosik et al. (2011) for vSun (top) and l (bottom).
Current usage metrics show cumulative count of Article Views (full-text article views including HTML views, PDF and ePub downloads, according to the available data) and Abstracts Views on Vision4Press platform.
Data correspond to usage on the plateform after 2015. The current usage metrics is available 48-96 hours after online publication and is updated daily on week days.
Initial download of the metrics may take a while.