Fig. 13
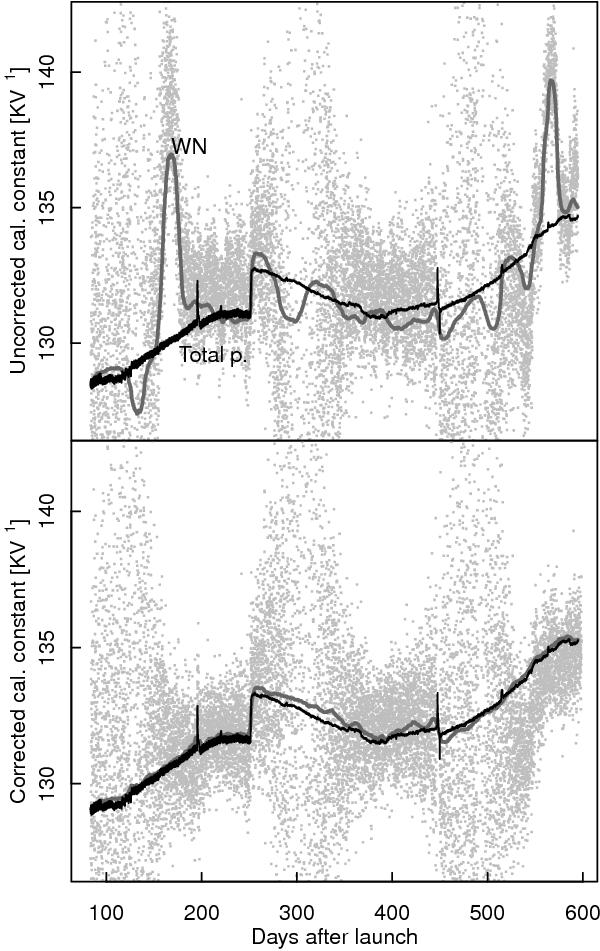
Time evolution of the calibration constant used to convert detector voltages into a thermodynamic temperature in Kelvin. The top panel shows the comparison for ADC uncorrected LFI25S-11 diode data between the raw dipole gains (grey dots) and the reciprocal of total-power sky detector voltage (black line), the latter scaled to have the same mean level as the gains. Two highly significant departures can be seen around day 160 and 560 together with lower level variations over most of the time range. The thick dark grey line shows inverse white noise estimates, again scaled to the same gain level, but filtered with a 100 ring moving median filter to reduce the scatter. As expected, this follows the dipole gains. The lower panel shows the same thing, but after the ADC correction has been applied to the TOD data.
Current usage metrics show cumulative count of Article Views (full-text article views including HTML views, PDF and ePub downloads, according to the available data) and Abstracts Views on Vision4Press platform.
Data correspond to usage on the plateform after 2015. The current usage metrics is available 48-96 hours after online publication and is updated daily on week days.
Initial download of the metrics may take a while.