Fig. 9
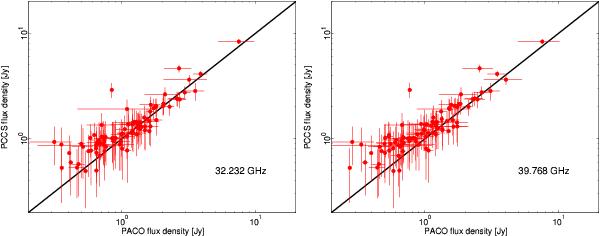
Comparison between the PACO sample (Massardi et al. 2011; Bonavera et al. 2011; Bonaldi et al. 2013) and the extrapolated, colour-corrected PCCS flux densities (DETFLUX) at 32 (left) and 40 GHz (right). The multiple PACO observations of each source have been averaged to a single flux density and therefore the uncertainties reflect the variability of the sources instead of the actual flux density accuracy of the measurements (a few mJy).
Current usage metrics show cumulative count of Article Views (full-text article views including HTML views, PDF and ePub downloads, according to the available data) and Abstracts Views on Vision4Press platform.
Data correspond to usage on the plateform after 2015. The current usage metrics is available 48-96 hours after online publication and is updated daily on week days.
Initial download of the metrics may take a while.