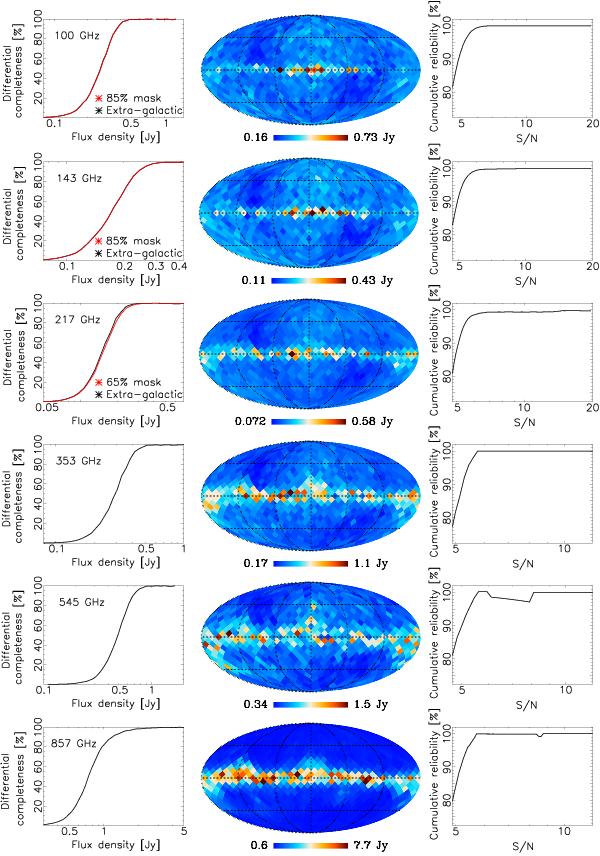
Fig. 6

Results of the internal validation for HFI channels. The quantities plotted are (left) completeness per bin, (middle) a map of sensitivity (the 50% completeness threshold in flux density), and (right) cumulative reliability as a function of S/N. The black curves in completeness are for the extragalactic zone described in Sect. 2.3. The red curves in completeness are for smaller masks used for the reliability estimation (if the extragalactic zone was not used). See text for discussion of the limitations of the injection reliability estimate used for 353 GHz and above.
Current usage metrics show cumulative count of Article Views (full-text article views including HTML views, PDF and ePub downloads, according to the available data) and Abstracts Views on Vision4Press platform.
Data correspond to usage on the plateform after 2015. The current usage metrics is available 48-96 hours after online publication and is updated daily on week days.
Initial download of the metrics may take a while.


