Fig. 4
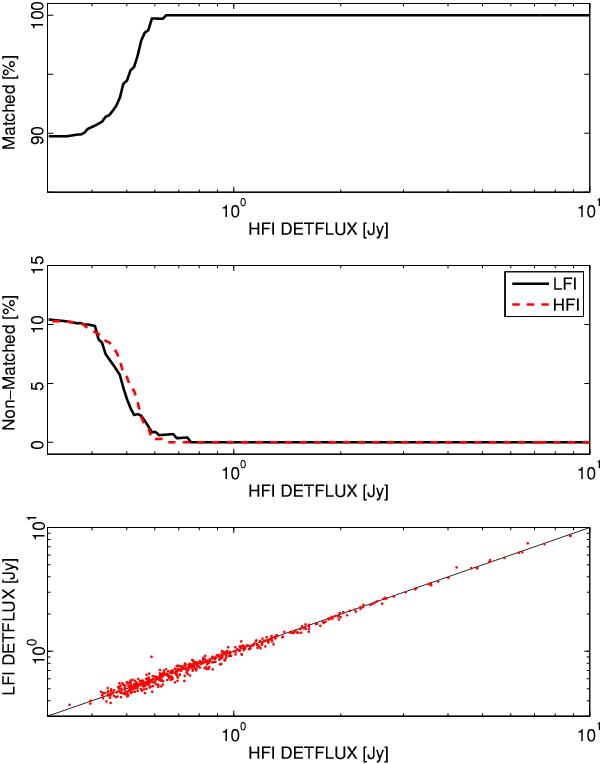
Test of internal consistency between the two implementations of the MHW pipeline at 30 GHz for | b | > 30°. Top panel: cumulative percentage of sources detected by both methods. Middle panel: cumulative percentage of sources detected by only one of the methods. Bottom panel: comparison of the recovered flux densities (DETFLUX).
Current usage metrics show cumulative count of Article Views (full-text article views including HTML views, PDF and ePub downloads, according to the available data) and Abstracts Views on Vision4Press platform.
Data correspond to usage on the plateform after 2015. The current usage metrics is available 48-96 hours after online publication and is updated daily on week days.
Initial download of the metrics may take a while.