Fig. 3
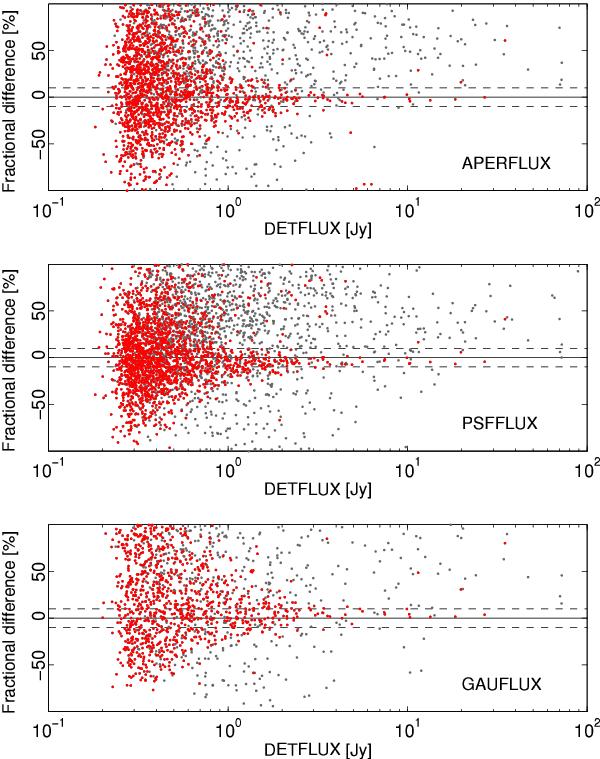
Comparison of the APERFLUX, PSFFLUX and GAUFLUX flux density estimates with the DETFLUX ones for the 100 GHz catalogue, (S − SDETFLUX) /SDETFLUX. Grey points correspond to sources below | b | < 5° while red ones show the ones for | b | > 5°. Dashed lines indicates the ± 10% uncertainty level.
Current usage metrics show cumulative count of Article Views (full-text article views including HTML views, PDF and ePub downloads, according to the available data) and Abstracts Views on Vision4Press platform.
Data correspond to usage on the plateform after 2015. The current usage metrics is available 48-96 hours after online publication and is updated daily on week days.
Initial download of the metrics may take a while.