Fig. 14
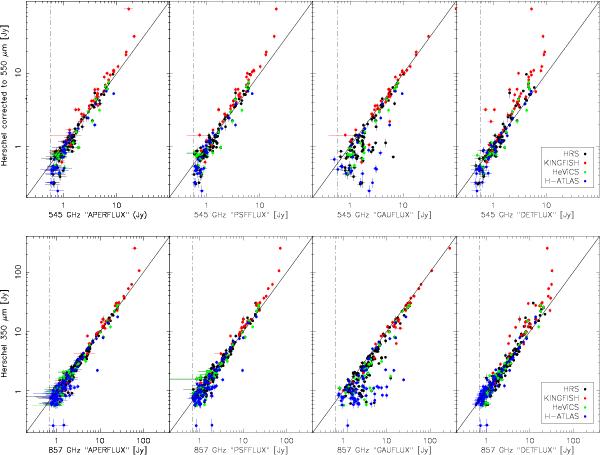
Comparison between Herschel and Planck flux densities at 545 GHz (top) and 857 GHz (bottom). All four PCCS flux densities estimates are shown, from left to right, APERFLUX, PSFFLUX, GAUFLUX, and DETFLUX. The Herschel 500 μm data have been extrapolated to 550 μm (545 GHz) assuming a spectral index of 2.7. The vertical dashed line shows the 90% completeness level of the PCCS. The diagonals show the line of equality between the flux densities.
Current usage metrics show cumulative count of Article Views (full-text article views including HTML views, PDF and ePub downloads, according to the available data) and Abstracts Views on Vision4Press platform.
Data correspond to usage on the plateform after 2015. The current usage metrics is available 48-96 hours after online publication and is updated daily on week days.
Initial download of the metrics may take a while.