| Issue |
A&A
Volume 569, September 2014
|
|
|---|---|---|
| Article Number | A83 | |
| Number of page(s) | 6 | |
| Section | Extragalactic astronomy | |
| DOI | https://doi.org/10.1051/0004-6361/201424228 | |
| Published online | 29 September 2014 | |
Spectral decomposition of the stellar kinematics in the polar disk galaxy NGC 4650A
1 ESO, Karl-Schwarzschild-Strasse 2, 85748 Garching Germany
e-mail: This email address is being protected from spambots. You need JavaScript enabled to view it.
2 INAF–Astronomical Observatory of Capodimonte, via Moiariello 16, 80131 Naples, Italy
Received: 18 May 2014
Accepted: 5 August 2014
Abstract
Context. The prototype of polar ring galaxies NGC 4650A contains two main structural components, a central spheroid, which is the host galaxy, and an extended polar disk. Both photometric and kinematic studies revealed that these two components co-exist on two different planes within the central regions of the galaxy.
Aims. The aim of this work is to study the spectroscopic and kinematic properties of the host galaxy and the polar disk in the central regions of NGC 4650A by disentangling their contributions to the observed galaxy spectrum.
Methods. We applied the spectral decomposition technique introduced in previous works to long-slit spectroscopic observations in the CaII triplet region. We focused the analysis along the PA = 152° that corresponds to the photometric minor axis of the host galaxy, where the superimposition of the two components is more relevant and the spectral decomposition is necessary. We aim to disentangle the stars that move in the equatorial plane of the host galaxy from those that move in the meridan plane, which is along the polar disk.
Results. We successfully disentangled the spectra of the two structural components of NGC 4650A and measured their line-of-sight velocity and velocity dispersion profiles, and the stellar content along PA = 152°. The host galaxy shows significant rotation along its photometric minor axis, indicating that the gravitational potential is not axisymmetric. The polar disk shows a kinematic decoupling: the inner regions counter-rotating with respect the outer-regions and the host spheroid. This suggests a complex formation history for the polar disk, characterised by mass accretion with decoupled angular momenta.
Key words: galaxies: kinematics and dynamics / galaxies: individual: NGC 4650A
© ESO, 2014
1. Introduction
The galaxy NGC 4650A is a polar disk galaxy (see Fig. 1). It is one of the best-investigated objects among the class of polar ring galaxies (PRGs). The PRGs are multi-spin systems composed of a central spheroid, which is the host galaxy, and a polar structure, which orbits nearly perpendicularly to the equatorial plane of the host galaxy. The latest studies on PRGs have revealed that this morphological type of galaxies includes both polar rings and polar disks, which have a different structure (i.e., light distribution, colors, age, and kinematics) and, probably, a different formation history (see Iodice 2014, for a review).
Why is it interesting to study PRGs? The multi-spin morphology of PRGs cannot be explained by the collapse of a single proto-galactic cloud, but some kind of interaction (galaxy-galaxy or galaxy-environment) needs to be invoked in the formation history of these systems. The gravitational interactions are the “carrying pillar” of the cold dark matter model for galaxy formation, and in this framework, both merger and gas accretion play a major role in building the structure of spheroid and disk (see Conselice 2014, as review). Thus, given their unique geometry, PRGs are among the best objects in the universe to study the physics of such processes. Moreover, the existence of two orthogonal components of the angular momentum makes the PRGs the ideal laboratory to derive the three-dimensional shape of the gravitational potential (see Combes 2014; Arnaboldi 2014, as reviews).
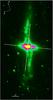 |
Fig. 1 NGC 4650A in the optical F450W HST band (Iodice et al. 2002). Image size is 1.7 × 2.4 arcmin. The white dashed lines indicate the directions of the FORS2 long slit spectra acquired by Iodice et al. (2006), along the major (PA = 62°) and minor (PA = 152°) axis of the host galaxy. East and north directions are indicated on the image. |
How could a PRG form? To date, three main formation scenarios have been proposed for PRGs: 1) a major dissipative polar merger of two disk galaxies with unequal mass (Bekki 1998; Bournaud & Combes 2003); 2) the tidal accretion of external material (gas and/or stars), captured by an early-type galaxy on a parabolic encounter (Reshetnikov & Sotnikova 1997; Bournaud & Combes 2003; Hancock et al. 2009); 3) the cold accretion of pristine gas along a filament (Macciò et al. 2006; Brook et al. 2008). As for any galaxy formation mechanism, the proposed scenarios need to account for the morphology, gas content, star and gas kinematics, and stability. Therefore, the key physical parameters that allow discriminating among the three formation scenarios are 1) the baryonic mass (stars plus gas) ratio between the host galaxy and polar structure; 2) the kinematics and orbital distributions of the stars in the host galaxy; 3) the metallicity and star formation rate in the polar structure.
In the last ten years, extensive observational campaigns were carried out to derive the above quantities for NGC 4650A and, thus, to outline the structure and formation history of this fascinating and intriguing galaxy. Optical (HST B, V, and I bands) and near-infrared (J, H, and Ks bands) photometry, emission and absorption line long-slit spectroscopy and HI radio emission showed that the polar structure is a disk, rather than a ring, because its stars and dust can be traced inward within the host galaxy, down to ~1.2 kpc from the galaxy nucleus (Arnaboldi et al. 1997; Iodice et al. 2002; Gallagher et al. 2002; Swaters & Rubin 2003). The polar disk contains a large amount of HI (~1011 M⊙), which is four times more extended than the optical stellar disk (out to 40 kpc from the galaxy center). Thus the baryonic mass in the polar structure is equal or even larger than that in the host galaxy, which is a gas-free object. The polar disk has a sub-solar metallicity Z = 0.2 Z⊙, and there is no metallicity gradient along this component (Spavone et al. 2010). The host galaxy in NGC 4650A has morphology, light distribution, and colors that resemble those of an S0 galaxy. Optical long-slit spectra along the major and minor axis of the host galaxy (Iodice et al. 2006) have confirmed that this component is rotationally-supported with a maximum rotation velocity along the major axis of vrot ≃ 80 − 100 km s-1. Some rotation is measured also along the minor axis outside of 1 kpc. The velocity dispersion remains almost constant (σ ~ 65 km s-1) at all radii and along both axes. These measurements put the host galaxy in NGC 4650A far from the Faber-Jackson relation for early-type galaxies (see Iodice et al. 2006; Iodice 2014), and show lower central velocity dispersion with respect to spheroids of comparable luminosity. From dynamical studies on NGC 4650A, the best models predict a flattened E6-E7 dark halo with its major axis aligned along the plane of the polar disk itself (Combes & Arnaboldi 1996; Napolitano et al. 2014).
In summary, the collected data, and the overall structure and morphology indicate that NGC 4650A is consistent with being a polar disk galaxy formed through the accretion of external cold gas from cosmic web filaments (see Spavone et al. 2010).
Nevertheless, the kinematic measurements and the dynamical models of NGC 4650A contain two major sources of uncertainty. The first is the limitation of 1D long-slit spectra that cannot trace the full two-dimensional warped geometry of the polar disk. The second is the contamination of the kinematics of the host galaxy by the stars in the polar disk, in the regions where the two components coexist. Indeed, the stellar kinematics of the host galaxy along its photometric minor axis (PA = 152°) are not what is expected for axisymmetric systems. In the inner 1 kpc, the velocity dispersion profile is slightly asymmetric with respect to the galaxy center. Moreover, outside 1 kpc, the velocity dispersion rise up to 120 km s-1 and the rotation velocity increases up to ~70 km s-1. Previous analysis was not able to give a unique interpretation for these effects, and suggested three viable explanations (Iodice et al. 2006) (i) a non axisymmetric structure of the host galaxy in NGC 4650A; (ii) a contamination by the stellar motion in the polar disk; or (iii) a contamination by stronger Paschen lines in a mixed stellar population.
In this paper, we investigate the scenario where the polar disk contaminates the kinematics of the host galaxy. Our aim is to separate the stellar kinematics of the two components and, therefore, to remove their mutual contamination on the observed velocity distribution along the line of sight – by applying a spectral decomposition technique to the available FORS2 long-slit spectra (Iodice et al. 2006).
In this paper, we adopt a distance to NGC 4650A of 43.4 Mpc and H0 = 73 km s-1 Mpc-1, which implies a scale of 0.21 kpc arcsec-1 (from the NASA/IPAC Extragalactic Database).
This paper is structured as follows: in Sect. 2, we describe the analysis performed on the long slit spectra; results are discussed in Sect. 3, and concluding remarks are drawn in Sect. 4.
2. Analysis
As stated in the introduction, the aim of this work is to disentangle the relative contribution of the polar disk towards the inner regions of the host galaxy in NGC 4650A, where the two structural components overlap along the line of sight. To this aim, we apply the spectral decomposition technique described in Coccato et al. (2011, 2013), which is an implementation of the pPXF fitting code (Cappellari & Emsellem 2004), to the FORS2 spectra (Iodice et al. 2006).
The spectra were obtained with FORS2 at the UT4 of the ESO Very Large Telescope (VLT, Chile) in service mode. The FORS2 was equipped with the grism GRIS 1028z+29 and a long-slit 1.̋6 wide. The spectral resolution was σ ~ 70 km s-1 measured at 8600 Å. We refer to Iodice et al. (2006) for more information on the instrumental set-up, data acquisition, and reduction.
2.1. Spectral decomposition
The spectral decomposition code builds two optimal templates as a linear combination of stellar spectra from two input libraries. These two optimal templates are convolved by two Gaussian functions with independent velocities and velocity dispersions. The two convolved optimal templates are then normalised to their median values within a desired wavelength range W, and multiplied by two factors F1 and F2 = T − F1, where T is the median flux of the observed galaxy spectrum in the wavelength range W. These steps are embedded in a χ2 minimisation loop till convergence. Multiplicative polynomials that account for the shape of the continuum are included in the process. The spectral decomposition code returns the velocities (V1,V2), velocity dispersions (σ1,σ2), the flux contribution F1 of the first component, and the best fitting templates of the two components.
In our fitting process, we define the wavelength range W to be 8500 Å <λ< 8800 Å and normalise the input galaxy spectra, so that T = 1. The parameters F1 and F2 are then the fractional contributions to the median galaxy flux of the hosting galaxy and the polar disk, respectively.
The accuracy of the spectral decomposition results and the ability to break the degeneracies between the various parameters (i.e., flux ratio of the two components, the choice of the stellar templates, and the kinematics) depend on how different the stellar components are, on the instrumental set-up, and on the observed signal-to-noise ratio. In our case, the limiting parameter for the analysis is the wavelength range, which contains only few spectral features (CaII triplet).
Ad-hoc assumptions can be made to decrease the number of free parameters in the fit and to reduce degeneracies between the various parameters in the spectral decomposition process. Katkov et al. (2013) and Fabricius et al. (2014) adopted a non parametric kinematic fit, which was used to constrain the kinematics of the two components and fit their stellar populations on a later stage. In our work, we adopt a different approach, following the prescriptions listed below.
-
1.
Constrain the stellar template of the host galaxy usinginformation on regions where the disk contribution is negligible(Sect. 2.2).
-
2.
Constrain the flux ratio between the host galaxy and the polar disk using the light profile obtained by collapsing the long-slit spectra along the dispersion direction (Sect. 2.3).
In Sect. 3, we present the results of the spectral decomposition on NGC 4650A.
2.2. Host galaxy template
Spectra obtained along the major axis of the host galaxy (PA = 62°) on the NE side of NGC 4650A, and outside the inner ~3′′<R< 10′′ do not contain any relevant disk contribution (see Fig. 1). Therefore, they can be used to obtain the stellar template that describes the mean properties of the stellar population of the host galaxy.
To extract best stellar template of the host galaxy, we fit the radially binned galaxy spectra with a selection of stars from the CaII triplet library of Cenarro et al. (2001), which have a spectral resolution of 1.5 Å (FWHM). The stellar library contains 88 giant stars that sample the log g, Teff, and [Fe/H] parameter space with spectral types ranging from O to M. We broadened the stars in the library to match the instrumental Line Spread Function (LSF) of our FORS2 observations. The LSF has been parametrized with a Gaussian Function and higher order Hermite Polynomials (σ = 2.0 Å, h3 = 0.0, h4 = −0.16), as measured from the comparison arc spectra in the regions of the detector relevant for our analysis. In these regions, we did not observe significant variations of the LSF.
The fit was performed by setting the contribution of the disk component in the spectral decomposition code to zero. The code determined a best fitting template as a linear combination of the stars in the library for each radial bin. These best fitting templates are very similar (variations have a standard deviation of 0.7%), suggesting a negligible radial dependence of the stellar populations in the host galaxy. We therefore defined the host galaxy template as the mean spectrum of the best fitting templates at different radii. Having constrained the host galaxy stellar template will reduce considerably the degeneracies in the spectral decomposition code.
In Fig. 2 we compare the best fitting templates for the various radial bins and their mean spectrum, which we use to define the host galaxy template. The best-fitting templates are composed mainly of GIII (~50%, in light) and KIII (~35%) giant stars and a small contribution from young O, B, and A stars (~10%) and MIII giants (<5%). The lack of strong Balmer absorption line features in the studied wavelength range, such as Hβ, prevented a more accurate determination of the age of the stellar population.
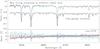 |
Fig. 2 Upper panel: spectra of the best fitting templates determined at different radial bins (along the major axis of the host galaxy at PA = 62°; 3′′<R< 10′′, NE side of the galaxy. See the slit orientation shown in Fig. 1). The average of these spectra is shown in black (shifted by −0.2 for clarity purposes); it is be used as template spectrum for the host galaxy in the spectroscopic decomposition (see text for details). Lower panel: deviations of the templates from the mean spectrum. |
2.3. Flux ratio between spheroid and disk
In this section, we exploit the different surface brightness radial profiles of the host galaxy and the polar disk along the slit at PA = 152° to reduce the degeneracies between their fluxes, kinematics, and stellar populations when applying the spectral decomposition. The use of photometric constraints to spectral decomposition techniques has been successfully applied also in previous works (i.e., Johnston et al. 2012).
According to Iodice et al. (2002), we model the light profile of the long-slit at PA = 152° with the sum of two components, a Sersic law for the host galaxy, G(R), and an exponential law, D(R), to model the light distribution in the polar disk. The host galaxy is parametrized by ![Mathematical equation: \begin{equation} G(R) = \mu_{\rm e} + k(n) \left[\left( \frac{R}{r_{\rm e}}\right)^{1/n} -1\right], \end{equation}](/articles/aa/full_html/2014/09/aa24228-14/aa24228-14-eq41.png) (1)where R is the galactocentric distance along PA = 152°, re and μe are the effective radius and effective surface brightness respectively, and k(n) = 2.17n − 0.355. The polar disk is parametrized by
(1)where R is the galactocentric distance along PA = 152°, re and μe are the effective radius and effective surface brightness respectively, and k(n) = 2.17n − 0.355. The polar disk is parametrized by 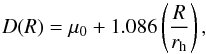 (2)where μ0 and rh are the central surface brightness and scalelength of the polar disk.
We applied a photometric offset of Δμ = 33.8 mag to the instrumental magnitudes measured from the long-slit profile, so that the surface brightness profile matches the one derived from the HST image of NGC 4650A in the F814W filter (see Fig. 6 in Iodice et al. 2002).
The best fit of the scaled light profile gives the following values for the above structural parameters: μe = 19.30 ± 0.08 mag/arcsec2, re = 2.00 ± 0.05 arcsec, n = 1.2 ± 0.1, μ0 = 20.20 ± 0.06 mag/arcsec2, and rh = 5.8 ± 0.1 arcsec.
In the fit, we considered the same wavelength range used in the spectral decomposition (8500 Å <λ< 8800 Å). Figure 3 shows the results of the photometric decomposition.
At each radial bin R, we use the photometric decomposition to set a starting guess value of F1 as
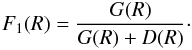 In our convention, component 1 is the host galaxy, whereas component 2 is the polar disk. We have F2(R) = 1 − F1(R) by construction at each R.
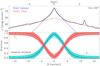 |
Fig. 3 Light contribution of the host galaxy and the polar disk. Upper panel: the long-slit luminosity profile (instrumental surface brightness) obtained by collapsing the long-slit spectrum (PA = 152°) along the wavelength direction in the 8500 <λ< 8800 region. The profile is decomposed into the contribution of a Sersic profile (associated to the host galaxy, in blue) and an exponential disk (associated to the polar disk, in red). Bottom panel: fractional contribution of the host galaxy (F1, in blue) and the polar disk (F2, in red) with respect to the median galaxy flux (normalized to 1). For a given radial bin R, the spectral decomposition code computes the best fit value |

3. Results of the spectroscopic decomposition
Following Iodice et al. (2006), we radially binned the spectrum along PA = 152° to reach a minimum signal-to-noise ratio (S/N) of 50 per pixel. At each radial bin R, we applied the spectroscopic decomposition, fixing the stellar template of the host galaxy to the optimal template determined in Sect. 2.2 and using a selection of O, A, B, G, K, and M stars from the Cenarro et al. (2001) library for the polar disk. At each radial bin, the flux contribution of the host galaxy is given by F1(R) (see Sect. 2.3); the best fitting value  is searched in the
  range. The amplitude of this range is consistent with the errors on the photometric decomposition as described in Sect. 2.3. A detection threshold of F1,2 = 0.2 is used for each component (see Sect. 3.2).
As an example, we show the result of the spectroscopic decomposition in one radial bin in Fig. 4.
3.1. Kinematics
Figure 5 shows the rotation curves and the velocity dispersion radial profiles of the host galaxy and the polar disk, along the host galaxy photometric minor axis. The contribution of the host galaxy to the total galaxy spectrum is negligible outside 5 arcsec ( ), whereas the contribution of the polar disk is negligible inside 1′′ (
 ). In the intermediate regions 1′′< | R | < 5′′, the two components co-exist and the spectroscopic decomposition is needed to separate and measure their properties independently.
The rotation curve of the polar disk is “S”-shaped with the central ~3 arcsec (~0.6 kpc) counter-rotating with respect the outer regions. The maximum amplitude of the rotation is ~70 km s-1, which is measured at 15′′(~3) kpc. The maximum amplitude of the counter-rotation is ~50 km s-1, which is measured at 2′′( ~ 0.4) kpc.
Rotation of ~70 km s-1 is observed also for the host galaxy. Since the observed position angle PA = 152° corresponds to the host galaxy photometric minor axis, the observed rotation indicates that the gravitational potential is not axisymmetric.
The line-of-sight velocity dispersion σLOS within 5′′( ~ 1) kpc is σLOS ~ 60 km s-1 for both components. In the outer regions, the velocity dispersion of the polar disk increases up to σLOS ≈ 120 km s-1. The contamination from the host galaxy in these regions is below the detection limit, which is <20%. This implies that the polar disk is dynamically hot, if compared to typical disks of spiral galaxies.
Unfortunately, the S/N of our spectra is not enough to reliably measure higher order moments of the velocity distributions (h3 and h4). Indeed, when including higher moments in the LOSVD parametrization, the fit procedure became unstable. The general shapes of the rotation curves shown in Fig. 5 did not change dramatically, but the higher moments were jumping from positive to negative values with a strong dependence from the starting guesses; this made it impossible to resolve the degeneracy between the kinematic parameters of the two components. The non inclusion of h3 and h4 in the fit could have introduced a bias in our results towards higher rotational velocities, or different σ (e.g. higher/lower estimate of σ for negative/positive h4). Nevertheless, we believe that this bias is small: our measurements agree well with those of Iodice et al. (2006, in which a single component fit was performed) in the regions where one component dominates (with the exception of the outermost measurement of σ at 12′′).
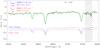 |
Fig. 4 Example of results of the spectroscopic decomposition at a given location (R = −3′′, South east, PA = 152°). The observed spectrum of NGC 4650A (black) is decomposed into the contribution of the polar disk (red) and the host galaxy (blue). Regions excluded from the fit are shaded by diagonal black lines. The best fit model is shown in green. |
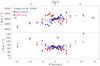 |
Fig. 5 Stellar rotation curves (top) and velocity dispersion profiles (bottom) of the two kinematics components in NGC 4650A measured along PA = 152°. Measurements referring to the host galaxy and the polar disk are shown by the blue and red circles, respectively. Kinematics of components whose fractional flux contribution F1,2 is below the detection limit 0.2 are not shown. Results from a single component fit (Iodice et al. 2006) are shown for comparison (black asterisks). |
3.2. Detection threshold and errors on kinematics
Errors on kinematics are computed by means of Monte Carlo simulations. For each radial bin Rbin, we constructed a set of 100 simulated spectra by combining the best fit models of the host galaxy and the polar disk. The light contributions of the two components to the simulated spectrum are given by F1(Rbin) (host galaxy) and 1 − F1(Rbin) (polar disk), as defined in Sect. 2.3. We added a Gaussian noise to match the S/N measured at Rbin, and a systematic component that accounts for residuals from sky subtraction.
We then performed the spectroscopic decomposition on the 100 simulated spectra and took the standard deviations of the 100 measurements of each kinematic quantity (i.e., V1,V2,σ1, and σ2) as error. Errors are shown in Fig. 5.
In the simulations, the velocity error of a component that contributes less than 20% to the total galaxy light is ΔV ≥ 100 km s-1. We therefore set F1,2 = 0.2 as a detection limit for each component (represented by the dashed horizontal line in Fig. 3). This limit is consistent with the one found in Coccato et al. (2013).
3.3. Stellar content of the polar disk
If we consider the entire radial range, the best-fitting templates of the disk are composed mainly of GIII (~45%, in light) and KIII (~35%) giant stars with contamination from young O, B, and A stars (~15%), and MIII giant stars (<5%). The contribution of young stars has a radial gradient: it is lower in the inner 1 kpc (up to ~10% of the galaxy flux for R ≤ 6′′) and higher in the outer regions (up to ~30% for R> 6′′).
Our estimates for the stellar type content in the polar disk are slightly lower than those reported by Iodice et al. (2006), which estimated a contamination of young stars up to 50% for R> 6′′ (along the same position angle). The difference arises from the different analysis and the number of stars used in the stellar library. We evaluate the fraction (in light) of young stars by using the entire available wavelength range (8500 Å <λ< 8800 Å), whereas they considered only the Pa(17–14) versus CaII equivalent width ratio. Moreover, they used one A and one K template star, whereas we used the Cenarro et al. (2001) library.
4. Conclusions
We studied the kinematics and stellar content of the two main components in NGC 4650A, which are the central spheroid (host galaxy) and the polar disk (see Fig. 1). These two components coexist in the central region of the galaxy; therefore, a careful spectral decomposition is needed to isolate their respective contributions to the observed galaxy spectrum. To this aim, we applied the spectroscopic decomposition developed in Coccato et al. (2011) to the long-slit spectroscopic observations of Iodice et al. (2006) obtained with FORS2 at the VLT.
We focused the analysis along the photometric minor axis of the host galaxy (PA = 152°), where the superposition of the two components is more relevant. The main results are the following:
-
Rotation. Both components, the hostgalaxy and the polar disk, rotate along PA = 152°. The rotation curve of the polar disk is “S”-shaped with the central ~0.6 kpc counter-rotating with respect to the outer regions and the host galaxy.
-
Velocity dispersion. The velocity dispersion within ~1 kpc is ~60 km s-1 for both components. In the outer regions, the velocity dispersion of the polar disk increases up to ≈120 km s-1. The contamination from the host galaxy in these regions is below the detection limit of our decomposition.
-
Stellar content. The stellar light of the host galaxy is composed mainly by giant GIII (~50%) and KIII (~35%) stars with a small contribution from young O–A stars, and MIII giants (<15%). The stellar light of the polar disk is also dominated by giant GIII (~45%) and KIII (~35%) stars with a minor contribution from young O–A stars and MIII giants (<20%). The contribution of young stars has a radially increasing gradient towards outer regions, being less than ~10% of the galaxy flux in the inner 1 kpc and reaching a higher fraction in the outer regions (up to ~30% for R> 1 kpc).
For the first time, the spectral decomposition along the minor axis of NGC 4650A has separated the contributions of the polar disk and the host galaxy to the total rotation velocity and dispersion observed along the line-of-sight. In doing so, we have addressed the uncertainties and the ambiguities previously pointed out by Iodice et al. (2006; see Sect. 1). Specifically, we note the following:
-
The rotation of the host galaxy along its photometric minor axis isan intrinsic property; it is not an artifact caused by thecontamination of the stars in the polar disk that lie along the sameline of sight velocity distribution. The host galaxy minor axisrotation indicates that the gravitational potential is nonaxi-symmetric, suggesting triaxiality. The triaxial scenario isalso supported by the radial change of ellipticity and positionangle (which are indeed indications of triaxiality, e.g.,Binney 1978; Bertola &Galletta 1979) that is observed in the isophotes ofthe host galaxy (Iodice et al. 2006).
-
Our results support the picture in which the polar disk of NGC 4650A formed through several accretion episodes. The counter-rotating nature of the polar disk indicates that the accreted material had different angular momenta. The ionized gas and the HI rotate along the same direction as the outer disk (Whitmore et al. 1987; van Gorkom et al. 1987; Arnaboldi et al. 1997). This suggests that the gas cloud that formed the stars in the outer disk was the latest to be accreted and that it had removed the pre-existing counter-rotating gas associated with the stars in the central 5′′ (Thakar & Ryden 1996; Pizzella et al. 2004). This interpretation is consistent with the radial gradient of O-A stars in the disk. Indeed, the higher fraction of O-A stars in the outer regions of the disk with respect to the inner regions suggests that the accretion episodes occurred at different times with the stars at larger radii in the disk being formed later. The age difference between the central and outer regions is consistent with the predition of cosmological simulation, where counter-rotating disks form via filament accretion (Algorry et al. 2014).
-
The increase of velocity dispersion observed along PA = 152° is an intrinsic property of the stars in the polar disk and not the result of the superimposition of stars from the two components along the line of sight. The higher velocity dispersion of the stars in the outer regions of the polar disk, combined with the larger fraction of young O-A stars, suggest that the outer regions of the disk formed later.
The piece of information, which is still missing, is the three-dimensional shape of the overall dark matter halo. The complexity of the host-galaxy kinematics revealed by our analysis indicates that the full two-dimensional maps of the kinematics are needed to recover it. In this framework, data collected with the second generation integral field spectrograph MUSE at VLT (Bacon et al. 2010) combined with our spectral decomposition analysis will be the key (i) to further investigate higher order moments in the velocity distribution and their impact on the kinematics; (ii) to recover the shape of the dark matter halo and the dark matter content in NGC 4650A; and (iii) to confirm the triaxial shape of the gravitational potential.
Acknowledgments
E.I. wishes to thank the European Southern Observatory for having given financial support and hospitality during her visit in July 2013, within the ESO Scientific Visitor program. The authors thank R. van den Bosch, O. Gerhard, N. R. Napolitano, and T. de Zeeuw for useful comments and discussions. The authors wish to thank the anonymous referee for his/her constructive feedback. This work is based on observations taken at the ESO La Silla Paranal Observatory within the Program ID 70.B-0277.
References
- Algorry, D. G., Navarro, J. F., Abadi, M. G., et al. 2014, MNRAS, 437, 3596 [NASA ADS] [CrossRef] [Google Scholar]
- Arnaboldi, M. 2014, in Multi-Spin Galaxies, eds. E. Iodice, & E. M. Corsini, ASP Conf. Ser., 486, 161 [Google Scholar]
- Arnaboldi, M., Oosterloo, T., Combes, F., Freeman, K. C., & Koribalski, B. 1997, AJ, 113, 585 [Google Scholar]
- Bacon, R., Accardo, M., Adjali, L., et al. 2010, in SPIE Conf. Ser., 7735 [Google Scholar]
- Bekki, K. 1998, ApJ, 499, 635 [CrossRef] [Google Scholar]
- Bertola, F., & Galletta, G. 1979, A&A, 77, 363 [NASA ADS] [Google Scholar]
- Binney, J. 1978, MNRAS, 183, 779 [NASA ADS] [CrossRef] [Google Scholar]
- Bournaud, F., & Combes, F. 2003, A&A, 401, 817 [NASA ADS] [CrossRef] [EDP Sciences] [Google Scholar]
- Brook, C. B., Governato, F., Quinn, T., et al. 2008, ApJ, 689, 678 [NASA ADS] [CrossRef] [Google Scholar]
- Cappellari, M., & Emsellem, E. 2004, PASP, 116, 138 [NASA ADS] [CrossRef] [Google Scholar]
- Cenarro, A. J., Cardiel, N., Gorgas, J., et al. 2001, MNRAS, 326, 959 [NASA ADS] [CrossRef] [Google Scholar]
- Coccato, L., Morelli, L., Corsini, E. M., et al. 2011, MNRAS, 412, L113 [NASA ADS] [CrossRef] [Google Scholar]
- Coccato, L., Morelli, L., Pizzella, A., et al. 2013, A&A, 549, A3 [NASA ADS] [CrossRef] [EDP Sciences] [Google Scholar]
- Combes, F. 2014, in Multi-Spin Galaxies, eds. E. Iodice, & E. M. Corsini, ASP Conf. Ser., 486, 207 [Google Scholar]
- Combes, F., & Arnaboldi, M. 1996, A&A, 305, 763 [NASA ADS] [Google Scholar]
- Conselice, C. J. 2014, ARA&A, in press [arXiv:1403.2783] [Google Scholar]
- Fabricius, M. H., Coccato, L., Bender, R., et al. 2014, MNRAS, 441, 2212 [NASA ADS] [CrossRef] [Google Scholar]
- Gallagher, J. S., Sparke, L. S., Matthews, L. D., et al. 2002, ApJ, 568, 199 [NASA ADS] [CrossRef] [Google Scholar]
- Hancock, M., Smith, B. J., Struck, C., Giroux, M. L., & Hurlock, S. 2009, AJ, 137, 4643 [NASA ADS] [CrossRef] [Google Scholar]
- Iodice, E. 2014, in Multi-Spin Galaxies, eds. E. Iodice, & E. M. Corsini, ASP Conf. Ser., 486, 39 [Google Scholar]
- Iodice, E., Arnaboldi, M., De Lucia, G., et al. 2002, AJ, 123, 195 [NASA ADS] [CrossRef] [Google Scholar]
- Iodice, E., Arnaboldi, M., Saglia, R. P., et al. 2006, ApJ, 643, 200 [NASA ADS] [CrossRef] [Google Scholar]
- Johnston, E. J., Aragón-Salamanca, A., Merrifield, M. R., & Bedregal, A. G. 2012, MNRAS, 422, 2590 [NASA ADS] [CrossRef] [Google Scholar]
- Katkov, I. Y., Sil’chenko, O. K., & Afanasiev, V. L. 2013, ApJ, 769, 105 [NASA ADS] [CrossRef] [Google Scholar]
- Macciò, A. V., Moore, B., & Stadel, J. 2006, ApJ, 636, L25 [NASA ADS] [CrossRef] [Google Scholar]
- Napolitano, N. R., Iodice, E., & Arnaboldi, M. 2014, in Multi-Spin Galaxies, eds. E. Iodice, & E. M. Corsini, ASP Conf. Ser., 486, 217 [Google Scholar]
- Pizzella, A., Corsini, E. M., Vega Beltrán, J. C., & Bertola, F. 2004, A&A, 424, 447 [NASA ADS] [CrossRef] [EDP Sciences] [Google Scholar]
- Reshetnikov, V., & Sotnikova, N. 1997, A&A, 325, 933 [NASA ADS] [Google Scholar]
- Spavone, M., Iodice, E., Arnaboldi, M., et al. 2010, ApJ, 714, 1081 [NASA ADS] [CrossRef] [Google Scholar]
- Swaters, R. A., & Rubin, V. C. 2003, ApJ, 587, L23 [NASA ADS] [CrossRef] [Google Scholar]
- Thakar, A. R., & Ryden, B. S. 1996, ApJ, 461, 55 [NASA ADS] [CrossRef] [Google Scholar]
- van Gorkom, J. H., Schechter, P. L., & Kristian, J. 1987, ApJ, 314, 457 [NASA ADS] [CrossRef] [Google Scholar]
- Whitmore, B. C., McElroy, D. B., & Schweizer, F. 1987, ApJ, 314, 439 [NASA ADS] [CrossRef] [Google Scholar]
All Figures
|
Fig. 1 NGC 4650A in the optical F450W HST band (Iodice et al. 2002). Image size is 1.7 × 2.4 arcmin. The white dashed lines indicate the directions of the FORS2 long slit spectra acquired by Iodice et al. (2006), along the major (PA = 62°) and minor (PA = 152°) axis of the host galaxy. East and north directions are indicated on the image. |
| In the text | |
|
Fig. 2 Upper panel: spectra of the best fitting templates determined at different radial bins (along the major axis of the host galaxy at PA = 62°; 3′′<R< 10′′, NE side of the galaxy. See the slit orientation shown in Fig. 1). The average of these spectra is shown in black (shifted by −0.2 for clarity purposes); it is be used as template spectrum for the host galaxy in the spectroscopic decomposition (see text for details). Lower panel: deviations of the templates from the mean spectrum. |
| In the text | |
|
Fig. 3 Light contribution of the host galaxy and the polar disk. Upper panel: the long-slit luminosity profile (instrumental surface brightness) obtained by collapsing the long-slit spectrum (PA = 152°) along the wavelength direction in the 8500 <λ< 8800 region. The profile is decomposed into the contribution of a Sersic profile (associated to the host galaxy, in blue) and an exponential disk (associated to the polar disk, in red). Bottom panel: fractional contribution of the host galaxy (F1, in blue) and the polar disk (F2, in red) with respect to the median galaxy flux (normalized to 1). For a given radial bin R, the spectral decomposition code computes the best fit value |
| In the text | |
|
Fig. 4 Example of results of the spectroscopic decomposition at a given location (R = −3′′, South east, PA = 152°). The observed spectrum of NGC 4650A (black) is decomposed into the contribution of the polar disk (red) and the host galaxy (blue). Regions excluded from the fit are shaded by diagonal black lines. The best fit model is shown in green. |
| In the text | |
|
Fig. 5 Stellar rotation curves (top) and velocity dispersion profiles (bottom) of the two kinematics components in NGC 4650A measured along PA = 152°. Measurements referring to the host galaxy and the polar disk are shown by the blue and red circles, respectively. Kinematics of components whose fractional flux contribution F1,2 is below the detection limit 0.2 are not shown. Results from a single component fit (Iodice et al. 2006) are shown for comparison (black asterisks). |
| In the text | |
Current usage metrics show cumulative count of Article Views (full-text article views including HTML views, PDF and ePub downloads, according to the available data) and Abstracts Views on Vision4Press platform.
Data correspond to usage on the plateform after 2015. The current usage metrics is available 48-96 hours after online publication and is updated daily on week days.
Initial download of the metrics may take a while.