Fig. 5
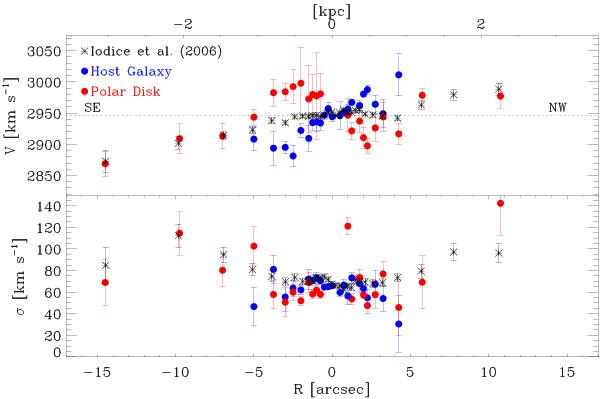
Stellar rotation curves (top) and velocity dispersion profiles (bottom) of the two kinematics components in NGC 4650A measured along PA = 152°. Measurements referring to the host galaxy and the polar disk are shown by the blue and red circles, respectively. Kinematics of components whose fractional flux contribution F1,2 is below the detection limit 0.2 are not shown. Results from a single component fit (Iodice et al. 2006) are shown for comparison (black asterisks).
Current usage metrics show cumulative count of Article Views (full-text article views including HTML views, PDF and ePub downloads, according to the available data) and Abstracts Views on Vision4Press platform.
Data correspond to usage on the plateform after 2015. The current usage metrics is available 48-96 hours after online publication and is updated daily on week days.
Initial download of the metrics may take a while.