Fig. 4
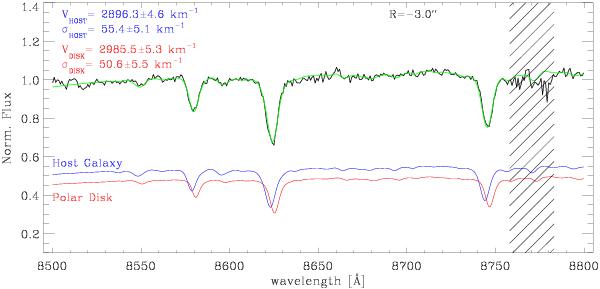
Example of results of the spectroscopic decomposition at a given location (R = −3′′, South east, PA = 152°). The observed spectrum of NGC 4650A (black) is decomposed into the contribution of the polar disk (red) and the host galaxy (blue). Regions excluded from the fit are shaded by diagonal black lines. The best fit model is shown in green.
Current usage metrics show cumulative count of Article Views (full-text article views including HTML views, PDF and ePub downloads, according to the available data) and Abstracts Views on Vision4Press platform.
Data correspond to usage on the plateform after 2015. The current usage metrics is available 48-96 hours after online publication and is updated daily on week days.
Initial download of the metrics may take a while.