Fig. 2
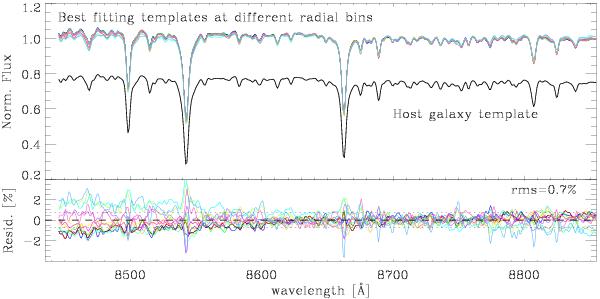
Upper panel: spectra of the best fitting templates determined at different radial bins (along the major axis of the host galaxy at PA = 62°; 3′′<R< 10′′, NE side of the galaxy. See the slit orientation shown in Fig. 1). The average of these spectra is shown in black (shifted by −0.2 for clarity purposes); it is be used as template spectrum for the host galaxy in the spectroscopic decomposition (see text for details). Lower panel: deviations of the templates from the mean spectrum.
Current usage metrics show cumulative count of Article Views (full-text article views including HTML views, PDF and ePub downloads, according to the available data) and Abstracts Views on Vision4Press platform.
Data correspond to usage on the plateform after 2015. The current usage metrics is available 48-96 hours after online publication and is updated daily on week days.
Initial download of the metrics may take a while.