| Issue |
A&A
Volume 569, September 2014
|
|
|---|---|---|
| Article Number | L4 | |
| Number of page(s) | 5 | |
| Section | Letters | |
| DOI | https://doi.org/10.1051/0004-6361/201424173 | |
| Published online | 17 September 2014 | |
The RCB star V854 Centauri is surrounded by a hot dusty shell ⋆,⋆⋆
1
Laboratoire Lagrange, UMR 7293, Univ. Nice Sophia-Antipolis, CNRS,
Observatoire de la Côte d’Azur,
06300
Nice,
France
e-mail: This email address is being protected from spambots. You need JavaScript enabled to view it.
2
Department of Physics & Astronomy, Macquarie
University, Sydney,
NSW
2109,
Australia
3
European Southern Observatory, Casilla 19001, Santiago 19, Chile
Received:
9
May
2014
Accepted:
22
July
2014
Abstract
Aims. The hydrogen-deficient supergiants known as R Coronae Borealis (RCB) stars might be the result of a double-degenerate merger of two white dwarfs (WDs), or a final helium shell flash in a planetary nebula central star. In this context, any information on the geometry of their circumstellar environment and, in particular, the potential detection of elongated structures, is of great importance.
Methods. We obtained near-IR observations of V854 Cen with the AMBER recombiner located at the Very Large Telescope Interferometer (VLTI) array with the compact array (B ≤ 35 m) in 2013 and the long array (B ≤ 140 m) in 2014. At each time, V854 Cen was at maximum light. The H- and K-band continua were investigated by means of spectrally dependant geometric models. These data were supplemented with mid-IR VISIR/VLT images.
Results. A dusty slightly elongated overdensity is discovered both in the H- and K-band images. With the compact array, the central star is unresolved (Θ ≤ 2.5 mas), but a flattened dusty environment of 8 × 11 mas is discovered whose flux increases from about ~20% in the H band to reach about ~50% at 2.3μm, which indicates hot (T ~ 1500 K) dust in the close vicinity of the star. The major axis is oriented at a position angle (PA) of 126 ± 29°. Adding the long-array configuration dataset provides tighter constraints on the star diameter (Θ ≤ 1.0 mas), a slight increase of the overdensity to 12 × 15 mas and a consistent PA of 133 ± 49°. The closure phases, sensitive to asymmetries, are null and compatible with a centro-symmetric, unperturbed environment excluding point sources at the level of 3% of the total flux in 2013 and 2014. The VISIR images exhibit a flattened aspect ratio at the 15−20% level at larger distances (~1′′) with a position angle of 92 ± 19°, marginally consistent with the interferometric observations.
Conclusions. This is the first time that a moderately elongated structure has been observed around an RCB star. These observations confirm the numerous suggestions for a bipolar structure proposed for this star in the literature, which were mainly based on polarimetric and spectroscopic observations.
Key words: techniques: high angular resolution / stars: individual: V854 Cen / circumstellar matter / stars: mass-loss
Based on observations made with the VLTI at Paranal Observatory under program 091.D-0030 and 093.D-0056.
Figure 4 is available in electronic form at http://www.aanda.org
O. Chesneau passed away shortly after submitting this Letter. We express our profound sadness on this premature demise and convey our deepest condolences to his family.
© ESO, 2014
1. Introduction
The R Coronae Borealis (RCB) stars are rare hydrogen-deficient carbon-rich supergiants, best known for their spectacular declines in brightness at irregular intervals (Clayton 2012; De Marco et al. 2002). Two evolutionary scenarios have been suggested for producing an RCB star, a double-degenerate merger of two white dwarfs (WD), or a final helium-shell flash in a planetary nebula central star. However, the discovery that RCB stars have large amounts of 18O is interpreted as a serious argument in favor of the merger scenario (Clayton et al. 2011, 2007). One may speculate that the merger scenario leads to some observational consequences, such as a fast rotation for the remnant star that leads to a circumstellar environment with an axis of symmetry. Polarimetry has been the main technique to reveal these symmetries, yet the results have so far never been fully conclusive (Yudin et al. 2003; Clayton et al. 1997; Stanford et al. 1988)
V854 Cen is an unusual member of the RCB class owing to its relatively large hydrogen content and also to the polycyclic aromatic hydrocarbons detected in the mid-IR (among other oddities). Extensive polarimetric observations have been reported (Kameswara Rao & Raveendran 1993; Whitney et al. 1992). Another striking aspect of this star is the fast wind that was spectroscopically detected, which reaches several hundreds of km s-1 (Clayton et al. 2013, 2003, 1993; Lawson et al. 1999; Kameswara Rao & Lambert 1993; Lawson 1992). The key aspect of the polarimetric observations reported in Whitney et al. (1992) is that the emission lines were unpolarized, which implies that they were formed outside regions of high dust concentration. Kameswara Rao & Lambert (1993) also provided strong arguments that V854 Cen may be at the origin of the bipolar nebula based on high-resolution spectroscopy. HST long-slit, far-ultraviolet spectra of V854 Cen showed that the C II emission region around V854 Cen is significantly extended by about 2.5′′ (Clayton & Ayres 2001).
With the advent of optical interferometry, many dusty environments around evolved stars were resolved (Chesneau 2011; Chesneau et al. 2009). Some first attempts to monitor the dust production of the RCB RY Sgr at high spatial resolution were performed with the MIDI/VLTI instrument (Leão et al. 2007). A few observations of V854 Cen are reported in Bright et al. (2011). But the limited (u,v) coverage still hampered detecting a clear departure from spherical symmetry.
This Letter presents optical interferometry measurements obtained with the Very Large Telescope Interferometer (VLTI) and reports the discovery of a moderately elongated structure around V854 Cen. The observations are presented in Sect. 2. In Sect. 3 we analyze the AMBER H, K continuum measurements by means of simple geometrical spectrally dependent models together with VISIR mid-IR images. The results are then discussed in Sect. 4.
2. Observations
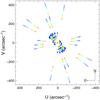 |
Fig. 1 Spectrally dispersed (u,v) coverage of the compact 2013 and extended 2014 configuration of the AMBER observations. |
The interferometric observations were obtained with the low spectral resolution mode of AMBER (R = 35), a three-telescope combiner located at the VLTI (Petrov et al. 2007). The observations were performed with the 1.8 m auxiliary telescopes (ATs) under photometric conditions, using the compact configuration (B ≤ 35 m) in 2013 and the long configuration (B ≤ 140 m) in 2014. The observations log is presented in Table 1 and the (u,v) plan coverage of the compact configuration is plotted in Fig. 1. We reduced the data using the standard Amber data reduction software amdlib v3.0.3b1 (Chelli et al. 2009; Tatulli et al. 2007). The visibilities secured in 2013 and 2014 are represented in Fig. 2. Noteworthy, the American Association of Variable Star Observers (AAVSO ) database shows that V854 Cen was at maximum light, V ~ 7.5−7.2 when the 2013 and 2014 AMBER observations were obtained.
The AMBER visibilities, a proxy of size and shape of the system, show strong variations as a function of spatial frequencies and as a function of wavelengths. This means that the object is resolved by AMBER and that its shape spectrally varies between the H and K bands. The closure phases, a proxy of asymmetries in the image of the system, are equal to zero within the uncertainties. This means that this probably is a centro-symmetric object.
V854 Cen was observed on 30 of June 2008 with the mid-infrared imager VISIR/VLT (Lagage et al. 2004) as part of an imaging survey of post-AGB stars and related objects (Lagadec et al. 2011). The images were obtained with a pixel scale of 0.075′′ and a field of view of 19.2 × 19.2 arcsec through the SiC filter (λ = 11.65 μm , Δλ 2.34 μm). Narrow-band filter images were also obtained, but had a too low signal-to-noise ratio for scientific use. The data were processed as described by Lagadec et al. (2011), with an additional step to remove horizontal stripes produced by the mid-infrared detector, for which we used filtering in the Fourier space. Figure 3 displays an image of V854 Cen obtained through the SiC filter at 11.65 μm (Δλ 2.34 μm) for which the contrast of the faintest regions was enhanced. The bright point-source is clearly surrounded by a fainter structure with a largest extent of ~3′′.
3. Analysis
We analyzed the AMBER data with the fitOmatic routine (Millour et al. 2009a), which enabled us to introduce different spectra for different simple geometric components. Various combinations of geometrical models were tested, including uniform disks, Gaussian disks, rings, power-law and exponential-law-profile disks. Our best-match model for the compact array is a two-component model, consisting of an unresolved uniform disk (Θ ≤ 2.5 mas, star component), and a flattened Gaussian (shell component) with a FWHM of the minor axis of 8 ± 1 mas, and a major axis of 11 ± 3 mas. The orientation of the major axis is 126±29°. But it must be kept in mind that the (u,v) coverage is not ideal for an accurate determination of the PA angle and flattening of the structure. The quality of the fit is relatively good with a reduced χ2 of 1.5. Combining the 2013 compact-array data with the 2014 long-array data brings consistent new information. The star remains unresolved (Θ ≤ 1.0 mas), and a slight increase of the apparent diameter with a minor axis of 12 ± 2 mas, and a major axis of 15 ± 5 mas is measured (reduced χ2 of 4.9). The orientation of the major axis is 133±49°. The aspect ratio of the shell is moderate, and we note that a round structure of Θ = 12.3 ± 2 could also fit the data, albeit with a larger reduced χ2 of 6.0. Assuming a disk-like geometry, the observed flattening would correspond to an inclination of i ≤ 60°. The spectra of both components are spatially and spectrally isolated. The star flux relative to the total flux steadily decreases from 85% at 1.53 μm to 42% at 2.49 μm , while the shell relative flux increases from 15% to 58%, respectively, with photometric errors at the level of 25%. Assuming a temperature of 6750 K for the central star (Bright et al. 2011), a hot temperature T ≤ 1400 K is inferred for the shell, which explains its direct detection in the near-IR.
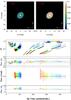 |
Fig. 2 Top: best geometrical models of the environment of V854 Cen at two selected wavelengths. Middle: 2013/2014 combined H (blue) and K (red) bands interferometric visibilities obtained with AMBER/VLTI compared with the signal from the polychromatic geometrical modeling. The wavelength label is in μm. Bottom: closure phases. Colors are the same. |
In Fig. 2, we show an illustration of the data fit with our best geometrical model. We tested for a companion star or a single clump of dust in the shell given the closure phase signal we observed on V854 Cen (null within the error bars). The test showed point-like sources whose flux were always lower than 3% of the total flux, which means that this is well below the detection limit for such asymmetries in the system with the current data down to a typical spatial resolution of 10 mas. We also tested a fully clumped uniform shell that contained up to 30 clumps, to see whether the high H-band visibilities could be explained this way, and this may indeed be an explanation of these high visibilities, although we cannot clearly infer the clump structure (because there are too many parameters to fit). The clumpy model is shown in Fig. 4. Importantly, the K-band visibilities (Fig. 2) at the highest spatial frequencies show a striking increase, after a deep decrease of visibilities near the spatial frequency of 100 arcsec-1. We interpret this feature as a first visibility lobe followed by a second visibility lobe that is clearly seen in the data. This is a typical feature of objects whose brightness distribution contains a sharp edge (see, for instance, an example in Millour et al. 2009b). Indeed, such a sharp edge would produce wiggles in the Fourier transformation of the image of the object (and hence in the visibilities). This supports the idea that the shell around V854 Cen is slightly better described by a (truncated) uniform disk (reduced χ2 of 4.9) than by a (smooth) Gaussian disk (reduced χ2 of 7.0), hence the sharp edges in the geometrical models shown in Fig. 2).
The lower contours of the VISIR image were analyzed to study their geometry by fitting 2D Gaussian at different flux levels. This yielded a good estimate of the nebula’s ellipticity and orientation as a function of the distance to its center. An elongated structure is discovered with a PA of 92±19° and an ellipticity of ~1.2. The resolved parts of the image represent 5.4% of the total flux in the SiC filter.
This PA is only marginally constistent with the PA derived with AMBER. It is possible that the spatial structure of the mass loss of V853 Cen is inhomogenous and randomly variable, which would explain this difference.
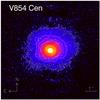 |
Fig. 3 11.65 μm VISIR image with enhanced contours of the external regions. |
We attempted to check the consistency of the PA determined by AMBER and VISIR and those detected by polarimetry. This information is not systematically published, therefore we refer to a few other publications. According to Kameswara Rao & Raveendran (1993), a position angle of ~65° is observed in the V band for maxima episodes during which the direct starlight is less affected by dust clumps and the polarimetric signal is lowest (such as at JD = 2 448 299.0 with V = 7.2). The U band is also highly polarized (2.82 ± 0.1%) with a measured PA angle of 44 ± 1°. Kameswara Rao & Lambert (1993) also proposed a polarized PA angle of 65±15° that corresponds to the scattering from a disk. Unfortunately, V854 Cen is very active and produces dust clumps at a high rate, which affects the photometric bands differently and hampers detecting a polarimetric signal from a stable circumstellar environment.
4. Discussion
We used a compact configuration (baselines limited to ~50 m) optimized for studying the circumstellar environment of V854 Cen. A moderately flattened dusty environment was discovered around V854 Cen. This shed new light on the evolutionary scenarios that have been suggested for the production of RCB stars: the double-degenerate merger of two WDs, which may lead to an axis of symmetry that promotes equatorially enhanced mass-loss and disks, or the final helium-shell flash in a planetary nebula central star, which may retain a central symmetry and promote no disk (Clayton et al. 2011, 2007; Webbink 1984).
Below we elaborate further on the importance of this discovery within the context of RCB star formation scenarios. What is the origin of this slightly elongated environment? The closure phases are close to zero, which excludes a close companion or single dust clump in the vicinity of the star during this period of maximum light that was brighter than 3% of the total flux, that is, a flux difference of at least 4 mag. This may imply that the dust is distributed in a disk that possibly is the relic of a past event, or that the observed spatial distribution reflects a field of randomly launched clumps in free-fall around the central star. The disk, or circumstellar structure, which would be constantly replenished by a discrete or continuous process, would explain the very hot temperature of the dust. An inspiring comparison may be made with the so-called Be stars (Rivinius et al. 2013), for which the fast rotation of the central star together with its pulsational properties triggers the formation of a dense circumstellar disk. But, this does not imply that the dust clumps are exclusively formed in the equatorial plane, because if they were, the light declines would be much less frequent this very active star. Furthermore, even though the original merged star might have been rotating quickly, when it became a giant and became larger by a factor of about 104, the surface speed would have dropped by that factor. The RCB stars are known to be slow rotators, and the narrow emission lines of V854 Cen are unresolved (≤20 km s-1 , Kameswara Rao & Lambert 1993). V854 Cen has a well-known single-pulsation period (43.2 days) whose phase is related to the formation of the dust (Crause et al. 2007). Convection may also contribute to the launching process of the dust clumps, like in cool supergiant stars.
The intermediate inclination of the system (we recall that i ≤ 60°) implies that the dust clumps that are regularly launched must originate from the high latitudes of the star to intercept the line of sight and dim its visual flux this deeply! This indicates a non radial formation and launching process of the carbonaceous dust clumps.
The polarization properties of V854 Cen are similar (albeit weaker) to those of the intermediate-luminosity red transient (ILOT) V4332 Sgr (Kamiński & Tylenda 2013; Berger et al. 2009) that suffered an outburst in 1994 and later developed the characteristics of a large giant. ILOTs are outbursts with energies intermediate between those of novae and supernovae (Kasliwal 2012) examples of which are V838 Mon (Bond et al. 2003) or V1309 Sco (Tylenda et al. 2011). Kamiński & Tylenda (2013) show that the polarized continuum of V4332 Sgr in 2011 disagrees with the unpolarized emission lines. This is interpreted as evidence for a disk seen at high inclination that completely obscures the central source. The star light would then reach us after scattering on dust located above and below the disk. The emission lines, on the other hand, would derive from photoexcitation by stellar radiation of the molecules located in the material above and below the plane. This configuration is also observed for the Sakurai object (Hinkle & Joyce 2014; Chesneau et al. 2009), another object thought to have suffered a very late final helium flash. Noteworthy, strong abundance similarities between Sakurai object and V854 Cen sources were detected (Asplund et al. 1998).
If the merger scenario for the RCBs applies, then they too may be in the ILOT range if observed at the time of the merger. Two 0.5 M⊙ WDs will deliver quite a substantial amount of gravitational energy ( 549 erg), more than would be the case for a main-sequence star merger, therefore they may cluster in the upper region of the ILOT locus on the energy-time diagram. The stellar expansion that ensues would make the object a giant, as is the case for ILOTs. WD-WD merger simulations of RCB stars are still relatively crude (Staff et al. 2012) and do not simulate the possible formation of a disk. However, the post-merger is a fast rotator before the radial expansion. Magnetic fields, which were not included in the simulations probably play an important role because they potentially affect many aspects of the star activity, such as its pulsations and whether an axial-symmetry is established. An interesting possibility is that the dust clumps launched by the star from its high latitudes are not able to ballistically leave the system and accumulate in the equatorial plane in a process reminiscent of the so-called wind-compressed
disk proposed by Bjorkman & Cassinelli (1993). The launching conditions of dust around cool stars have recently been investigated in depth by Höfner (2009, 2007). More observations are needed to link the extended nebula detected by VISIR and the compact structure resolved with the VLTI. High angular resolution (~20−50 mas) polarimetric and coronagraphic imaging in the optical such as provided by the SPHERE/VLT instrument will be a key to achieve this goal and better understand the dust ejection mechanism in V854 Cen.
Online material
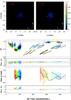 |
Fig. 4 Top: one of the best models for a clumpy environment of V854 Cen at two selected wavelengths with 30 clumps. Middle: 2013/2014 combined H (blue) and K (red) band interferometric visibilities obtained with AMBER/VLTI compared with the signal from the polychromatic geometrical modeling. The wavelength label is in μm. Bottom: closure phases. Colors are the same. |
Acknowledgments
A great thanks for the ESO staff for the help with these observations, and in particular Thomas Rivinius. We also thank the referee, Pierre Kervella, for his help in improving this paper. This work has made use of JMMC, CDS and AAVSO resources.
References
- Asplund, M., Gustafsson, B., Kameswara Rao, N., & Lambert, D. L. 1998, A&A, 332, 651 [NASA ADS] [Google Scholar]
- Berger, E., Soderberg, A. M., Chevalier, R. A., et al. 2009, ApJ, 699, 1850 [NASA ADS] [CrossRef] [Google Scholar]
- Bjorkman, J. E., & Cassinelli, J. P. 1993, ApJ, 409, 429 [NASA ADS] [CrossRef] [Google Scholar]
- Bond, H. E., Henden, A., Levay, Z. G., et al. 2003, Nature, 422, 405 [NASA ADS] [CrossRef] [PubMed] [Google Scholar]
- Bonneau, D., Clausse, J.-M., Delfosse, X., et al. 2006, A&A, 456, 789 [NASA ADS] [CrossRef] [EDP Sciences] [Google Scholar]
- Bright, S. N., Chesneau, O., Clayton, G. C., et al. 2011, MNRAS, 414, 1195 [NASA ADS] [CrossRef] [MathSciNet] [Google Scholar]
- Chelli, A., Utrera, O. H., & Duvert, G. 2009, A&A, 502, 705 [NASA ADS] [CrossRef] [EDP Sciences] [Google Scholar]
- Chesneau, O. 2011, in Asymmetric Planetary Nebulae 5 Conf., Poster Session, held in Bowness-on-Windermere, eds. A. A. Zijlstra, F. Lykou, I. McDonald, & E. Lagadec [Google Scholar]
- Chesneau, O., Clayton, G. C., Lykou, F., et al. 2009, A&A, 493, L17 [NASA ADS] [CrossRef] [EDP Sciences] [Google Scholar]
- Clayton, G. C. 2012, J. Am. Assoc. Var. Star Obs. (JAAVSO), 40, 539 [Google Scholar]
- Clayton, G. C., & Ayres, T. R. 2001, ApJ, 560, 986 [NASA ADS] [CrossRef] [Google Scholar]
- Clayton, G. C., Lawson, W. A., Whitney, B. A., & Pollacco, D. L. 1993, MNRAS, 264, L13 [NASA ADS] [CrossRef] [Google Scholar]
- Clayton, G. C., Bjorkman, K. S., Nordsieck, K. H., Zellner, N. E. B., & Schulte-Ladbeck, R. E. 1997, ApJ, 476, 870 [NASA ADS] [CrossRef] [Google Scholar]
- Clayton, G. C., Geballe, T. R., & Bianchi, L. 2003, ApJ, 595, 412 [NASA ADS] [CrossRef] [Google Scholar]
- Clayton, G. C., Geballe, T. R., Herwig, F., Fryer, C., & Asplund, M. 2007, ApJ, 662, 1220 [NASA ADS] [CrossRef] [Google Scholar]
- Clayton, G. C., Sugerman, B. E. K., Stanford, S. A., et al. 2011, ApJ, 743, 44 [NASA ADS] [CrossRef] [Google Scholar]
- Clayton, G. C., Geballe, T. R., & Zhang, W. 2013, AJ, 146, 23 [NASA ADS] [CrossRef] [Google Scholar]
- Crause, L. A., Lawson, W. A., & Henden, A. A. 2007, MNRAS, 375, 301 [NASA ADS] [CrossRef] [Google Scholar]
- De Marco, O., Clayton, G. C., Herwig, F., et al. 2002, AJ, 123, 3387 [NASA ADS] [CrossRef] [Google Scholar]
- Hinkle, K. H., & Joyce, R. R. 2014, ApJ, 785, 146 [NASA ADS] [CrossRef] [Google Scholar]
- Höfner, S. 2007, in Why Galaxies Care About AGB Stars: Their Importance as Actors and Probes, eds. F. Kerschbaum, C. Charbonnel, & R. F. Wing, ASP Conf. Ser., 378, 145 [Google Scholar]
- Höfner, S. 2009, in Cosmic Dust – Near and Far, eds. T. Henning, E. Grün, & J. Steinacker, ASP Conf. Ser., 414, 3 [Google Scholar]
- Kameswara Rao, N., & Lambert, D. L. 1993, AJ, 105, 1915 [NASA ADS] [CrossRef] [Google Scholar]
- Kameswara Rao, N. K., & Raveendran, A. V. 1993, A&A, 274, 330 [NASA ADS] [Google Scholar]
- Kamiński, T., & Tylenda, R. 2013, A&A, 558, A82 [NASA ADS] [CrossRef] [EDP Sciences] [Google Scholar]
- Kasliwal, M. M. 2012, PASA, 29, 482 [NASA ADS] [CrossRef] [Google Scholar]
- Lagadec, E., Verhoelst, T., Mékarnia, D., et al. 2011, MNRAS, 417, 32 [NASA ADS] [CrossRef] [Google Scholar]
- Lagage, P. O., Pel, J. W., Authier, M., et al. 2004, The Messenger, 117, 12 [NASA ADS] [Google Scholar]
- Lawson, W. A. 1992, MNRAS, 258, 33P [NASA ADS] [CrossRef] [Google Scholar]
- Lawson, W. A., Maldoni, M. M., Clayton, G. C., et al. 1999, AJ, 117, 3007 [NASA ADS] [CrossRef] [Google Scholar]
- Leão, I. C., de Laverny, P., Chesneau, O., Mékarnia, D., & de Medeiros, J. R. 2007, A&A, 466, L1 [NASA ADS] [CrossRef] [EDP Sciences] [Google Scholar]
- Millour, F., Chesneau, O., Borges Fernandes, M., et al. 2009a, A&A, 507, 317 [NASA ADS] [CrossRef] [EDP Sciences] [Google Scholar]
- Millour, F., Driebe, T., Chesneau, O., et al. 2009b, A&A, 506, L49 [NASA ADS] [CrossRef] [EDP Sciences] [Google Scholar]
- Petrov, R. G., Malbet, F., Weigelt, G., et al. 2007, A&A, 464, 1 [NASA ADS] [CrossRef] [EDP Sciences] [Google Scholar]
- Rivinius, T., Carciofi, A. C., & Martayan, C. 2013, A&ARv, 21, 69 [Google Scholar]
- Staff, J. E., Menon, A., Herwig, F., et al. 2012, ApJ, 757, 76 [NASA ADS] [CrossRef] [Google Scholar]
- Stanford, S. A., Clayton, G. C., Meade, M. R., et al. 1988, ApJ, 325, L9 [NASA ADS] [CrossRef] [Google Scholar]
- Tatulli, E., Millour, F., Chelli, A., et al. 2007, A&A, 464, 29 [NASA ADS] [CrossRef] [EDP Sciences] [Google Scholar]
- Tylenda, R., Hajduk, M., Kamiński, T., et al. 2011, A&A, 528, A114 [Google Scholar]
- Webbink, R. F. 1984, ApJ, 277, 355 [NASA ADS] [CrossRef] [Google Scholar]
- Whitney, B. A., Clayton, G. C., Schulte-Ladbeck, R. E., & Meade, M. R. 1992, AJ, 103, 1652 [NASA ADS] [CrossRef] [Google Scholar]
- Yudin, R. V., Evans, A., Barrett, P., et al. 2003, A&A, 412, 405 [NASA ADS] [CrossRef] [EDP Sciences] [Google Scholar]
All Tables
All Figures
|
Fig. 1 Spectrally dispersed (u,v) coverage of the compact 2013 and extended 2014 configuration of the AMBER observations. |
| In the text | |
|
Fig. 2 Top: best geometrical models of the environment of V854 Cen at two selected wavelengths. Middle: 2013/2014 combined H (blue) and K (red) bands interferometric visibilities obtained with AMBER/VLTI compared with the signal from the polychromatic geometrical modeling. The wavelength label is in μm. Bottom: closure phases. Colors are the same. |
| In the text | |
|
Fig. 3 11.65 μm VISIR image with enhanced contours of the external regions. |
| In the text | |
|
Fig. 4 Top: one of the best models for a clumpy environment of V854 Cen at two selected wavelengths with 30 clumps. Middle: 2013/2014 combined H (blue) and K (red) band interferometric visibilities obtained with AMBER/VLTI compared with the signal from the polychromatic geometrical modeling. The wavelength label is in μm. Bottom: closure phases. Colors are the same. |
| In the text | |
Current usage metrics show cumulative count of Article Views (full-text article views including HTML views, PDF and ePub downloads, according to the available data) and Abstracts Views on Vision4Press platform.
Data correspond to usage on the plateform after 2015. The current usage metrics is available 48-96 hours after online publication and is updated daily on week days.
Initial download of the metrics may take a while.