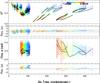
Fig. 4

Top: one of the best models for a clumpy environment of V854 Cen at two selected wavelengths with 30 clumps. Middle: 2013/2014 combined H (blue) and K (red) band interferometric visibilities obtained with AMBER/VLTI compared with the signal from the polychromatic geometrical modeling. The wavelength label is in μm. Bottom: closure phases. Colors are the same.
Current usage metrics show cumulative count of Article Views (full-text article views including HTML views, PDF and ePub downloads, according to the available data) and Abstracts Views on Vision4Press platform.
Data correspond to usage on the plateform after 2015. The current usage metrics is available 48-96 hours after online publication and is updated daily on week days.
Initial download of the metrics may take a while.