| Issue |
A&A
Volume 569, September 2014
|
|
|---|---|---|
| Article Number | A92 | |
| Number of page(s) | 8 | |
| Section | Interstellar and circumstellar matter | |
| DOI | https://doi.org/10.1051/0004-6361/201423754 | |
| Published online | 29 September 2014 | |
From the ashes: JVLA observations of water fountain nebula candidates show the rebirth of IRAS 18455+0448
1
Department of Earth and Space SciencesChalmers University of Technology,
Onsala Space Observatory,
439 92
Onsala,
Sweden
e-mail:
This email address is being protected from spambots. You need JavaScript enabled to view it.
2
Center for Astrophysics and Space Astronomy, Department of
Astrophysical and Planetary Sciences, University of Colorado,
389 UCB, Boulder, CO, 80309-0389, USA
3
Joint Institute for VLBI in Europe, Postbus 2, 7990 AA
Dwingeloo, The
Netherlands
4
Sterrewacht Leiden, Leiden University,
Postbus 9513, 2300 RA
Leiden, The
Netherlands
5
Centro de Radioastronomía y Astrofísica, UNAM, Apdo. Postal 3-72
(Xangari), 58089
Morelia, Michoacán, México
Received: 4 March 2014
Accepted: 24 July 2014
Abstract
Context. The class of water fountain nebulae is thought to represent the stage of the earliest onset of collimated bipolar outflows during the post-asymptotic giant branch phase. They thus play a crucial role in the study of the formation of bipolar planetary nebulae (PNe). To date, 14 water fountain nebulae have been identified. The identification of more sources in this unique stage of stellar evolution will enable us to study the origin of bipolar PNe morphologies in more detail.
Aims. Water fountain candidates can be identified based on the often double peaked 22 GHz H2O maser spectrum with a large separation between the maser peaks (often >100 km s-1). However, even a fast bipolar outflow will only have a moderate velocity extent in its maser spectrum when located close to the plane of the sky. In this project we aim to enhance the water fountain sample by identifying objects whose jets are aligned close to the plane of the sky.
Methods. We present the results of seven sources observed with the Jansky Very Large Array (JVLA) that were identified as water fountain candidates in an Effelsberg 100 m telescope survey of 74 AGB and early post-AGB stars.
Results. We find that our sample of water fountain candidates displays strong variability in their 22 GHz H2O maser spectra. The JVLA observations show an extended bipolar H2O maser outflow for one source, the OH/IR star IRAS 18455+0448. This source was previously classified as a dying OH/IR star based on the exponential decrease of its 1612 MHz OH maser and the lack of H2O masers. We therefore also re-observed the 1612, 1665, and 1667 MHz OH masers. We confirm that the 1612 MHz masers have not reappeared and find that the1665/1667 MHz masers have decreased in strength by several orders of magnitude during the last decade. The JVLA observations also reveal a striking asymmetry in the red-shifted maser emission of IRAS 19422+3506.
Conclusions. The OH/IR star IRAS 18455+0448 is confirmed to be a new addition to the class of water fountain nebulae. Its kinematic age is ~70 yr, but could be lower, depending on the distance and inclination. Previous observations indicate, with significant uncertainty, that IRAS 18455+0448 has a surprisingly low mass compared to available estimates for other water fountain nebulae. The available historical OH maser observations make IRAS 18455+0448 unique for the study of water fountain nebulae and the launch of post-AGB bipolar outflows. The other candidate sources appear high mass-loss OH/IR stars with partly radially beamed H2O masers.
Key words: stars: AGB and post-AGB / masers
© ESO, 2014
1. Introduction
The origin of the bipolar morphologies observed in a large number of young planetary nebulae (PNe) and post-asymptotic giant branch (AGB)/pre-PNe sources is a long-standing question. Various mechanisms explaining the observed morphologies have been invoked (Balick & Frank 2002). Of these, collimated outflows launched during the late AGB or early post-AGB phase has been suggested as the most direct explanation for the formation of bipolar PNe (e.g., Sahai & Trauger 1998). The origin of these collimated outflows, or bipolar jets, is however still unclear. The collimation of an outflow due to a magnetic field, similar to what is observed for proto-stars, is a promising candidate, even though such a field might require a binary companion or massive planet to be maintained sufficiently long (e.g., Garcia-Segura et al. 2014). Alternative common-envelope evolutionary scenarios in which a binary companion becomes engulfed by the expanding AGB star could also provide an explanation (e.g., Nordhaus et al. 2007).
Observed sources.
In order to constrain the launching mechanisms of bipolar outflows in late-type stars, it is important to find the youngest bipolar sources where the ejection of material has begun just recently. These are often still in, or just after, the AGB phase of their evolution. For these sources it can be possible to study simultaneously both the bipolar outflows as well as the remnants of their AGB envelopes. The youngest of the bipolar pre-PNe/post-AGB stars are the class of water fountain sources. These display H2O maser emission at velocities that can reach up to several hundred km s-1. This is significantly beyond that of the regularly expanding envelopes that can sometimes still be traced in OH masers, with typical expansion velocities of ~15 km s-1 (Likkel et al. 1992). Interferometric observations of these sources have revealed that they posses tightly collimated jets that excite H2O masers at the shocked interface ahead or around them (Imai 2007). These jets have kinematic ages of only a few tens to hundreds of years and synchrotron and maser polarization observations indicate that at least a few of them are collimated by a strong magnetic field (Vlemmings et al. 2006; Pérez-Sánchez et al. 2013). The Galactic scale height of the water fountain population, the heavy circumstellar extinction and observations of 12CO and 13CO appears to indicate that their progenitor stars are fairly massive (>4 M⊙ He et al. 2008; Suárez et al. 2008; Imai et al. 2012; Rizzo et al. 2013). None of the water fountains has had a binary companion directly confirmed, although jet-precession in some of them could be due to an embedded companion (Imai 2007; Yung et al. 2011).
Only 14 water fountains are known to date. Since their detection is often related to the observations of H2O masers spread over a very large velocity range, detection is necessarily biased towards bipolar sources closest to the line of sight. In order to identify water fountain nebulae whose jets lie close to the plane of the sky, a combination of single dish monitoring and interferometric observations is required. Here we present JVLA and Effelsberg observations of a number of candidate water fountain sources with a smaller spread of their H2O masers. The source sample, observations and data reduction are presented in Sect. 2. The resulting maser spectra and H2O maser variability are described in Sect. 3, and in particular the results of the confirmed water fountain IRAS 18455+0448 are discussed in Sect. 4.
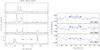 |
Fig. 1 Left: spectra of the H2O masers of IRAS 18455+0448 observed with the Effelsberg 100 m telescope (top three panels) and with the JVLA (bottom panel) at four different epochs (with different flux scales). From top to bottom, the epochs are 12−13 November 2009, 22−23 March 2011, 14 April 2011 and 6 June 2013. The arrows in the bottom panel indicate the spread of the previously observed OH masers and the vertical dashed line indicates the systemic velocity based on SiO maser observations. Right: confirmation of the disappearance of the OH masers at 1612, 1665 and 1667 MHz. The masers were observed with Effelsberg at 22 February 2010 (1665 and 1667 MHz) and 27 March 2010 (1612 MHz). The vertical dashed line indicated the systemic velocity and the horizontal dotted-dashed lines the 3σ noise limits. The arrows indicate the spread of OH masers observed by Lewis et al. (2001). |
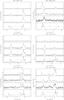 |
Fig. 2 Same as Fig. 1 (left) for the other six sources in our sample. We note the difference in flux scale for several of the observational epochs. The vertical dashed line indicates, where available, the literature averaged SiO maser velocity, otherwise the systemic velocity derived from the OH masers is used (see Table 1). |
2. Observations
2.1. The sample
The sources in our sample were originally observed as part of the observational campaign presented and discussed in Amiri (2011). In that work, a sample of 74 late AGB or early post-AGB objects was observed in an attempt to detect their H2O maser emission. In this work, we focused on seven sources that were either newly discovered or have distinct double or multipeaked H2O maser emission with a velocity spread close to that of the OH masers. The sources are listed in Table 1. One of the sources identified in Amiri (2011) as a water fountain candidate,IRAS 18455+0448, was also proposed as a water fountain based on later Effelsberg observations by Yung et al. (2013). As earlier observations indicated an exponential decline in the 1612 MHz OH maser line for this source (Lewis et al. 2001), we also performed new 1612, 1665, and 1667 MHz OH maser observations for IRAS 18455+0448.
2.2. Effelsberg observations
Observations of the 22.23508 GHz H2O masers in our sample were done with the Effelsberg telescope over three epochs: 12 and 13 November 2009, 22 and 23 March 2011, and 14 April 2011. For the first two epochs we used the 1.3 cm prime focus receiver in spectral line mode. The 1.3 cm focus secondary VLBI receiver was used for the third epoch observations.
The full width half maximum (FWHM) of the Effelsberg telescope is 40.̋2 at the maser frequency. Using the FFT spectrometer with 16 384 channels and a bandwidth of 100 MHz, equivalent to a velocity coverage of 1363 km s-1, centered at the stellar velocity, the resulting spectral resolution is 0.08 km s-1. The observations were made in position switching mode with a cycle of 1 min, sufficient to compensate for atmospheric fluctuations. The observing time for each source was 8−16 min at epoch 1, 8 min at epoch 2 and 12−24 min at epoch 3. The rms noise for the first, second and third epochs corresponds to 0.02−0.18, 0.06 and 0.07−0.3 Jy, respectively.
For the OH maser observations of IRAS 18455+0448, we used the 21/18 cm primary focus receiver. At the OH maser frequency the FWHM of the telescope corresponds to ~470 arcsec. Mainline OH maser observations at 1665.4018 and 1667.359 were performed on 22 Feb. 2010 with a bandwidth of 20 MHz and 16 384 channels which provides a channel spacing of ~0.2 km s-1. The total on source observing time was 2 h and 26 min. The observations of 1612 MHz masers were made on 27 March 2010 with a bandwidth of 100 MHz and 16384 channels corresponding to a channel spacing of ~1 km s-1. The total on source observing time was 72 min. The rms noise in channels free of emission is ~7 mJy for both epochs.
The data reduction was performed using the Continuum and Line Analysis Single-dish Software (CLASS) that is part of the GILDAS package1. We obtained the raw spectra in units of temperature counts. The spectra were converted to units of antenna temperature (TA) by applying the calibration noise temperature. We also corrected the spectra for atmospheric opacity and the gain-elevation effect, the measurements of which were provided by the observatory. Finally, the spectra were converted to Jy units by dividing the spectra by the sensitivity of the telescope at the maser frequency.
2.3. JVLA observations
In order to improve the positional accuracy of our sources for later VLBI observations and investigate the location and extent of the H2O masers, our sources were observed with the JVLA in C-configuration on 6 June 2013 (program 13A-088). We used a total bandwidth of 32 MHz centered at the H2O maser rest frequency in dual polarization. The original 8192 channels were averaged to produce a data set with 4096 channels of ~0.1 km s-1 width. The seven sources were observed interleaved with four phase calibrators (J2007+4029, J1851+0035, J1922+1530, and J1925+2106) during a total observing time of 3 h. Bandpass calibration was done using J2007+4029 and we performed periodic pointing observations at X-band.
The data calibration was performed using the Common Astronomy Software Application (CASA). As no suitable primary flux calibrator was visible during our short observing run, we rely on archive fluxes of our phase calibrators to determine the absolute flux of our sources. Based on this we conclude that our fluxes are uncertain at the level of 25%. Although the positions of the masers in our sample were determined by directly fitting the uv-data, we also produced images and spectra further averaging to 0.2 km s-1 channels. The typical rms in our spectra is 7.2 mJy/beam and the typical beamwidth is ~1.2′′ × 1.1′′. A direct comparison between the fluxes obtained from single-dish Effelsberg and from interferometric JVLA observations is possible, since H2O masers with typical sizes of only a few milliarcseconds are too compact to be resolved out using the JVLA in C-configuration.
3. Results
3.1. H2O maser spectra
The Effelsberg and JVLA H2O maser spectra for IRAS 18455+0448 and those for the other six sources are shown in Fig. 1 (left) and Fig. 2 respectively. All seven sources display significant variability in their H2O maser emission between the four epochs. In particular, we find strong variability for IRAS 19067+0811 and IRAS 19112+0819, which were undetected in our first Effelsberg epoch, while for IRAS 19254+1631 only the JVLA observations reveal clear blue-shifted emission. Moreover, IRAS 19069+0916 and IRAS 19422+3506, display variability of almost two orders of magnitude between different epochs. The strong variability could also be the cause of the initial non-detection of IRAS 18455+0448 (see however Sect. 4.1), IRAS 19112+0819 and IRAS 19254+1631 in earlier observations by Engels & Lewis (1996).
In all cases except IRAS 18455+0448, the H2O maser velocity spread is similar to that of the OH masers. While all of the sources display at least a prominent double peaked spectrum, IRAS 18455+0448, IRAS 19254+1631 and IRAS 19422+3506 also display several other strong maser features across their spectrum.
3.2. OH masers of IRAS 18455+0448
The OH maser spectra of IRAS 18455+0448 are shown in Fig. 1 (right). The OH 1612 MHz maser is not detected after being measured to have a peak intensity of ~40 mJy in 2000 (Lewis et al. 2001). In that epoch, the 1665 and 1667 MHz OH masers were observed to have peak fluxes of ~450 mJy and ~730 mJy respectively. In our current observations we only tentatively detect possible peaks of the 1665 and 1667 MHz OH masers at 25 ± 7 mJy (at Vlsr ≈ 38 km s-1) and 22 ± 7 mJy (at Vlsr ≈ 30 and 36 km s-1) respectively. The relative velocity, with respect to the star, of these potential maser peaks are less than what was measured in 2000 as indicated in Fig. 1 (right) by the arrow. The main-line masers have thus also faded by more than an order of magnitude over the last decade.
3.3. JVLA observations of the H2O maser components
Our observations with the JVLA allowed us to determine more accurate positions and to investigate the offset between the red- and blue-shifted masers. Although the ~1′′ JVLA resolution is not sufficient to directly resolve the individual components, the strength of the masers allows us to reach positional accuracies of a few to a few tens of milliarcseconds for the maser positions (considering θ ≈ Beam/(2 × S/N)), where S/N is the signal-to-noise ratio. We determined the maser positions by performing fits in the (u,v)-plane for each velocity channel assuming a single, unresolved, component (using the CASA code UVMULTIFIT, Martí-Vidal et al. 2014). Although in the spectra several individual features can be identified, these likely still consist of individual maser components blended in velocity. However, fitting multiple maser components within the relatively large JVLA beam would lead to poorly defined fits. The position errors determined from the u,v-fitting of a single component per velocity channel will, besides the aforementioned dependence on S/N and beam-size, contain the uncertainty related to the potential existence of multiple components in the beam. Component maps for IRAS 18455+0448 and IRAS 19422+3506 are shown in Figs. 3 and 4 respectively. The remaining sources are shown in Fig. 5. For all sources (except IRAS 19186+0315 where only red-shifted emission was detected), we determined the offset between the red- and blue-shifted emission by determining a S/N weighted average of the channel component positions. The results of this analysis are presented in Table 1. That same table lists the JVLA observed spread of the H2O masers velocities (ΔVH2O) and the centroid positions determined by S/N weighted averaging of all maser channels. As can be seen in Fig. 3, IRAS 18455+0448 is the only source for which a significant off-set, of 49 ± 15 mas, is measured.
4. Discussion
4.1. Nature of IRAS 18455+0448
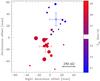 |
Fig. 3 The H2O maser distribution around IRAS 18455+0448 observed with the JVLA. Fits to the centroid position of individual maser velocity channels are potted scaled based on their flux and color coded according to velocity. Only masers detected at a signal-to-noise-ratio >15 are plotted. The positional uncertainties on the individual symbols range from ~15 mas for the brightest to ~30 mas for the weakest features. The error weighted mean positions of the blue- and red-shifted masers with corresponding error bars are also indicated. The scale, assuming a distance of 11.2 kpc is indicated in the bottom right corner. |
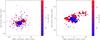 |
Fig. 4 Left: same as Fig. 3 for IRAS 19422+3506. All channels with a S/N> 15 are plotted. Positional uncertainties for the individuals spots range from ~2 mas to ~30 mas for the strongest and weakest plotted masers, respectively. No average offset is detected between the red- and blue-shifted masers. Right: similar to the left but only spots with S/N> 50 are plotted to highlight the northwest extension of the red-shifted masers. Individual errors range from ~2 mas to ~10 mas. |
IRAS 18455+0448 is the only source of the sample for which a clear separation is seen between the red- and blue-shifted masers (Fig. 3) and for which the H2O maser velocity spread is more than twice that of the OH masers. It was also one of the three sources in our Effelsberg survey that displayed H2O masers that were not detected in the previous survey by Engels & Lewis (1996) who reported an rms level of 0.2 Jy in 1990.
Based on the exponential fading of the 1612 MHz OH masers between 1988 and 2000, Lewis et al. (2001) suggested the source as the prototype of a “dying” OH/IR star. In their preferred model, the mass loss has gradually declined to close to 0. Considering the dust velocity (Ve,dust) is larger than that of the gas (Ve,gas), the expansion of both will differ. This results in a gradual decrease in the dust column density that shields the OH from the interstellar UV. The OH will thus be photo-dissociated more rapidly, thereby decreasing the column density in the maser region. This effect will become apparent after a time that is proportional to the expansion timescale from the photosphere to the OH maser region and the ratio Ve,gas/Ve,dust. This is on the order of 1000 yr for IRAS 18455+0448. As the satellite OH line has the strongest dependence on column density, it will initially be affected before the main line masers. In the framework of the above model, an abrupt termination of the mass loss would not produce the exponential decline in maser flux, nor would it affect the 1612 MHz masers before the main line masers. Thus, the model described by Lewis et al. (2001) is supported by the fact that now, ten years later, the main line masers have also decreased by at least an order of magnitude (Fig. 1, right).
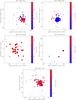 |
Fig. 5 Left: same as Fig. 3 for the remaining source in the sample. Depending on maser flux, different S/N cutoffs are used. For IRAS 19067+0611 all channels with S/N> 5 are plotted and error bars range from ~30 to 90 mas. For IRAS 19096+0916+0819 we use S/N> 25 and error bars range from ~5 to 18 mas. For IRAS 19112+0819, S/N> 5 and error bars range from ~25 to 90 mas. For IRAS 19186+0325, S/N> 5 and error bars range from ~75 to 90 mas. Finally, for IRAS 19254+1631, S/N> 10 and error bars range from ~10 to 45 mas. |
However, the model described above does not take the effect of maser pumping into account. As discussed in Gray et al. (2005), the response of the 1612 MHz OH maser flux could also be much more rapid if one takes into account a loss of radiative pumping efficiency after dust production has halted. In that case, a more rapid decline of mass loss can, already within a few tens of years, result in the observed exponential decay of the maser flux. The significant time-lag of at least a decade between the decay of the 1612 MHz and the 1665/67 MHz masers is however not as easily explained, as in this model the main line masers would be the first to disappear.
In the model of significantly decreasing mass loss, the H2O masers cannot be excited in the inner circumstellar envelope. This suggests that the fast H2O masers are excited in the interaction between a fast outflow and the remnant envelope as is found for water fountain nebulae. Our JVLA maser component map in Fig. 3 confirms that the red- and blue-shifted masers are separated by ~50 mas (~560 AU at 11.2 kpc). Considering the separation, both spatially and spectrally, and elongated morphology of the red- and blue-shifted masers, we can conclude that IRAS 18455+0448 belongs to the class of water fountain sources.
We can use the measured separation to make a crude estimate the kinematic age of IRAS 18455+0448. Assuming a constant fast outflow velocity, the age is given by ![Mathematical equation: \begin{equation} \left[\frac{t_{\rm kin}}{\rm yr}\right] = 4.74\left[\frac{D}{\rm kpc}\right]\left[\frac{\Delta_{\rm red-blue}}{\rm mas}\right]\left[\frac{\Delta V_{\rm H_2O}}{\rm km~s^{-1}}\right]^{-1}\tan\left[\frac{i}{\rm degrees}\right]\cdot \end{equation}](/articles/aa/full_html/2014/09/aa23754-14/aa23754-14-eq66.png) (1)Taken from Table 1, D is the distance to the source, Δred−blue the red- and blue-shifted maser separation, and ΔVH2O the velocity separation. Furthermore, i is the inclination from the plane of the sky. Although the distance to the IRAS 18455+0448 is uncertain, Lewis et al. (2001) argue that the luminosity of the source suggests it is located close to the far kinematic distance of 11.2 kpc (recalculated using the results from Reid et al. 2009) instead of the near kinematic distance (2.1 kpc), as in that case the luminosity would be very low for a post-AGB star. Adopting D = 11.2 (2.1) kpc and an inclination of i = 45°, we find tkin ≈ 67 (13) yr, making IRAS 18455+0448 one of the youngest water fountain nebulae (Imai 2007).
(1)Taken from Table 1, D is the distance to the source, Δred−blue the red- and blue-shifted maser separation, and ΔVH2O the velocity separation. Furthermore, i is the inclination from the plane of the sky. Although the distance to the IRAS 18455+0448 is uncertain, Lewis et al. (2001) argue that the luminosity of the source suggests it is located close to the far kinematic distance of 11.2 kpc (recalculated using the results from Reid et al. 2009) instead of the near kinematic distance (2.1 kpc), as in that case the luminosity would be very low for a post-AGB star. Adopting D = 11.2 (2.1) kpc and an inclination of i = 45°, we find tkin ≈ 67 (13) yr, making IRAS 18455+0448 one of the youngest water fountain nebulae (Imai 2007).
The rebirth of IRAS 18455+0448 as a water fountain source, provides us with important historical information on a water fountain progenitor. Its small OH maser expansion velocity of ~6 km s-1, implies a low main sequence mass of ~1.0 ± 0.5 M⊙ (Baud & Habing 1983), which is noticeably lower than the masses derived for CO detected water fountain sources (e.g., He et al. 2008; Rizzo et al. 2013) and from source kinematics (Imai et al. 2012).
In the context of the model proposed by Lewis et al. (2001), the OH maser observations would indicate a direct connection between the events leading to a gradual decrease in mass loss, which started ~1000 yr ago, and the launch of the jet ~70 yr ago. Such a relation is not obvious if the jet originates from interaction with a binary companion during a common-envelope (CE) phase. An outflow launched as a result from CE evolution, either due to direct envelope ejection, an explosive dynamo-driven jet or the formation of a circumstellar disk by shredding of the companion would act at timescales of only a few years (e.g., Nordhaus et al. 2007). The CE outflow would also not produce an obvious relation between the smooth exponential decay of 1612 MHz OH maser emission and the delayed decrease of 1665/67 MHz OH maser flux.
Instead of a gradual mass loss decrease, the main cause of the maser decay can also be, as mentioned above, the loss of pumping efficiency instead of a decrease of OH column density. In that case, the launch of the H2O maser jet could have occurred near simultaneously to a more rapid mass loss decrease or other event in which the dust that produces the infrared maser pump radiation is affected. In Lewis et al. (2001) it is however noted that there is no indication of any infrared variability of IRAS 18455+0448.
4.2. Nature of the remaining sources
None of the other sources in our sample have a H2O maser velocity range larger than that of the OH masers. Should the H2O masers occur in a fast bipolar outflow, we would thus expect these to lie predominantly in the plane of the sky. However, no significant offset between the flux averaged red- and blue-shifted emission peaks is seen. It is therefore more likely that the observed double peaked H2O maser spectra for these sources arise because of radial maser amplification. This indicates that the sources are high mass-loss OH/IR stars with a H2O maser shell beyond the acceleration region, where the largest velocity coherent maser path length is, as for the OH masers, in the radial direction (e.g., Engels & Lewis 1996). The multiple peaked structure, most notable in IRAS 19422+3506, could indicate that both radial and tangential amplification is operating in an extended maser envelope that encompasses both accelerating material closer to the star and constant velocity gas farther out. Alternatively, as argued by Engels et al. (1997) for the OH/IR star OH 39.7 + 1.5, the masers occur in the same region with mode switching between tangential and radial beaming occurring in phase with the pulsation cycle and an accompanying changes in physical conditions. As shown in Fig. 4, IRAS 19422+3506 is the only source besides IRAS 18455+0448 that shows some structure within the H2O maser envelope at scales probed by our JVLA observations. While the overall envelope appears spherical, and there is no appreciable offset between the red- and blue-shifted emission peaks, the red-shifted emission around − 40 km s-1 is offset by ~20 mas (~200 AU) from the rest of the red-shifted masers. Monitoring the motion of such a clearly distinct maser cloud in the circumstellar AGB envelope could show if the maser cloud results from a dense clumpy mass ejection or from turbulent motions in the envelope.
4.3. Maser variability
The H2O masers of all sources show significant variability between different epochs. The multi-epoch Effelsberg observations covered a timescale of ~500 days. We found that the H2O masers exhibit significant variability in flux density and spectral characteristics. We observed the rise of new maser features that differ by as much as 35 km s-1 in velocity from features detected in the earlier observations (Engels & Lewis 1996) for IRAS 19422+3506. For IRAS 18455+0448 the spectra show emission blue-shifted from the stellar velocity at VLSR ≈ 34.1 km s-1 between VLSR = 20 and 30 km s-1 (Fig.1, left). By our second epoch in March 2011 the spectrum had changed within the same blue shifted range and a weak red-shifted feature at ~46 km s-1 had appeared. One month later in April 2011, the most blue-shifted feature halved in flux density while the red-shifted component became stronger by a factor of a few. A further Effelsberg epoch was taken by Yung et al. (2013) in December 2011, which again showed two strong features at ~19 and ~46 km s-1 and a weak third feature even more blue-shifted at ~11 km s-1. Our JVLA observations from June 2013 show the now persisting red-shifted feature and show again an even more complex blue-shifted set of maser features between ~13−27 km s-1. By now, the velocity spread of the H2O masers is >38 km s-1 compared to the 12 km s-1 spread of the OH masers.
In Amiri (2011), it was found that the observed amount of strong variability is consistent with a variability timescale of several thousand days. This is similar to the typical OH/IR pulsation period. For Mira variables, a similar relation between variability timescale of the H2O masers and the pulsation period was found by Shintani et al. (2008). However, since the individual sources studied in this work are mainly OH/IR stars with periods up to ~2000 days, we do not have optical light curves available to examine whether any correlation exists between the stellar pulsation and H2O maser emission.
5. Conclusions
We have confirmed the previously “dead” OH/IR star IRAS 18455+0448 to be the newest member of the class of water fountain sources. The kinematic age of IRAS 18455+0448 is ~70 yr, with the main uncertainties being the yet unknown inclination of the bipolar outflow and its distance. This is the first time that a water fountain can be directly linked to a previously studied OH/IR star. Based on the originally low outflow velocity measured from the OH masers that have now disappeared, IRAS 18455+0448 is estimated to be a fairly low-mass star, in contrast to what is generally postulated for the typical water fountain progenitor. The applicability of the expansion velocity – main sequence mass relation, which yields this low mass, to individual sources is however highly uncertain. For example observations of CO and its isotopologues may provide further mass estimates (e.g., He et al. 2008). Furthermore, Very Long Baseline Interferometry (VLBI) observations will be needed to derive a more accurate distance, and constrain internal kinematics. If the original model describing the approaching death of IRAS 18455+0448 (Lewis et al. 2001) is correct, the launch of the bipolar outflow in recent years is linked to a longer term slow decline of the mass loss of the water fountain progenitor. This would be difficult to reconcile with several of the binary outflow generation models that often act on relatively short timescales. However, models where the exponential decrease
of the OH masers of IRAS 18455+0448 is the result of a more recent disturbance of the mass loss or maser pumping mechanism that is at the same time responsible for the launch of the outflow still need to be investigated in more detail.
The remaining six sources observed with the JVLA do not show any offset between the red- and blue-shifted masers, which would be expected for a bipolar outflow not developed close to the line of sight. The double peaked nature of their H2O maser spectra is more likely the result of radial maser beaming.
Acknowledgments
W.V. acknowledges support by the Swedish Research Council (VR), Marie Curie Career Integration Grant 321691 and ERC consolidator grant 614264. The research of N.A. was supported by the ESTRELA fellowship, the EU Framework 6 Marie Curie Early Stage Training program under contract number MEST-CT-2005-19669.
References
- Amiri, N. 2011, Ph.D. Thesis, Leiden University, https://openaccess.leidenuniv.nl/handle/1887/17981 [Google Scholar]
- Balick, B., & Frank, A. 2002, ARA&A, 40, 439 [NASA ADS] [CrossRef] [Google Scholar]
- Baud, B., & Habing, H. J. 1983, A&A, 127, 73 [NASA ADS] [Google Scholar]
- Chengalur, J. N., Lewis, B. M., Eder, J., & Terzian, Y. 1993, ApJS, 89, 189 [NASA ADS] [CrossRef] [Google Scholar]
- Eder, J., Lewis, B. M., & Terzian, Y. 1988, ApJS, 66, 183 [NASA ADS] [CrossRef] [Google Scholar]
- Engels, D., & Lewis, B. M. 1996, A&AS, 116, 117 [NASA ADS] [Google Scholar]
- Engels, D., Schmid-Burgk, J., & Walmsley, C. M. 1986, A&A, 167, 129 [NASA ADS] [Google Scholar]
- Engels, D., Winnberg, A., Walmsley, C. M., & Brand, J. 1997, A&A, 322, 291 [NASA ADS] [Google Scholar]
- Garcia-Segura, G., Villaver, E., Langer, N., Yoon, S.-C., & Manchado, A. 2014, ApJ, 783, 74 [NASA ADS] [CrossRef] [Google Scholar]
- Gray, M. D., Howe, D. A., & Lewis, B. M. 2005, MNRAS, 364, 783 [Google Scholar]
- He, J. H., Imai, H., Hasegawa, T. I., Campbell, S. W., & Nakashima, J. 2008, A&A, 488, L21 [NASA ADS] [CrossRef] [EDP Sciences] [Google Scholar]
- Imai, H. 2007, IAU Symp., 242, 279 [NASA ADS] [CrossRef] [Google Scholar]
- Imai, H., Chong, S. N., He, J.-H., et al. 2012, PASJ, 64, 98 [NASA ADS] [Google Scholar]
- Kim, J., Cho, S.-H., Oh, C. S., & Byun, D.-Y. 2010, ApJS, 188, 209 [NASA ADS] [CrossRef] [Google Scholar]
- Kim, J., Cho, S.-H., & Kim, S. J. 2013, AJ, 145, 22 [NASA ADS] [CrossRef] [Google Scholar]
- Lewis, B. M. 1997, ApJS, 109, 489 [NASA ADS] [CrossRef] [Google Scholar]
- Lewis, B. M., Oppenheimer, B. D., & Daubar, I. J. 2001, ApJ, 548, L77 [NASA ADS] [CrossRef] [Google Scholar]
- Likkel, L., Morris, M., & Maddalena, R. J. 1992, A&A, 256, 581 [NASA ADS] [Google Scholar]
- Martí-Vidal, I., Vlemmings, W. H. T., Muller, S., & Casey, S. 2014, A&A, 563, A136 [NASA ADS] [CrossRef] [EDP Sciences] [Google Scholar]
- Nakashima, J.-I., & Deguchi, S. 2003, PASJ, 55, 229 [NASA ADS] [Google Scholar]
- Nordhaus, J., Blackman, E. G., & Frank, A. 2007, MNRAS, 376, 599 [NASA ADS] [CrossRef] [Google Scholar]
- Pérez-Sánchez, A. F., Vlemmings, W. H. T., Tafoya, D., & Chapman, J. M. 2013, MNRAS, 436, L79 [NASA ADS] [CrossRef] [Google Scholar]
- Reid, M. J., Menten, K. M., Zheng, X. W., et al. 2009, ApJ, 700, 137 [NASA ADS] [CrossRef] [Google Scholar]
- Rizzo, J. R., Gómez, J. F., Miranda, L. F., et al. 2013, A&A, 560, A82 [NASA ADS] [CrossRef] [EDP Sciences] [Google Scholar]
- Sahai, R., & Trauger, J. T. 1998, AJ, 116, 1357 [NASA ADS] [CrossRef] [Google Scholar]
- Shintani, M., Imai, H., Ando, K., et al. 2008, PASJ, 60, 1077 [NASA ADS] [Google Scholar]
- Suárez, O., Gómez, J. F., & Miranda, L. F. 2008, ApJ, 689, 430 [NASA ADS] [CrossRef] [Google Scholar]
- te Lintel Hekkert, P., Versteege-Hensel, H. A., Habing, H. J., & Wiertz, M. 1989, A&AS, 78, 399 [NASA ADS] [Google Scholar]
- Vlemmings, W. H. T., Diamond, P. J., & Imai, H. 2006, Nature, 440, 58 [NASA ADS] [CrossRef] [PubMed] [Google Scholar]
- Yung, B. H. K., Nakashima, J.-i., Imai, H., et al. 2011, ApJ, 741, 94 [NASA ADS] [CrossRef] [Google Scholar]
- Yung, B. H. K., Nakashima, J.-i., Imai, H., et al. 2013, ApJ, 769, 20 [NASA ADS] [CrossRef] [Google Scholar]
All Tables
All Figures
|
Fig. 1 Left: spectra of the H2O masers of IRAS 18455+0448 observed with the Effelsberg 100 m telescope (top three panels) and with the JVLA (bottom panel) at four different epochs (with different flux scales). From top to bottom, the epochs are 12−13 November 2009, 22−23 March 2011, 14 April 2011 and 6 June 2013. The arrows in the bottom panel indicate the spread of the previously observed OH masers and the vertical dashed line indicates the systemic velocity based on SiO maser observations. Right: confirmation of the disappearance of the OH masers at 1612, 1665 and 1667 MHz. The masers were observed with Effelsberg at 22 February 2010 (1665 and 1667 MHz) and 27 March 2010 (1612 MHz). The vertical dashed line indicated the systemic velocity and the horizontal dotted-dashed lines the 3σ noise limits. The arrows indicate the spread of OH masers observed by Lewis et al. (2001). |
| In the text | |
|
Fig. 2 Same as Fig. 1 (left) for the other six sources in our sample. We note the difference in flux scale for several of the observational epochs. The vertical dashed line indicates, where available, the literature averaged SiO maser velocity, otherwise the systemic velocity derived from the OH masers is used (see Table 1). |
| In the text | |
|
Fig. 3 The H2O maser distribution around IRAS 18455+0448 observed with the JVLA. Fits to the centroid position of individual maser velocity channels are potted scaled based on their flux and color coded according to velocity. Only masers detected at a signal-to-noise-ratio >15 are plotted. The positional uncertainties on the individual symbols range from ~15 mas for the brightest to ~30 mas for the weakest features. The error weighted mean positions of the blue- and red-shifted masers with corresponding error bars are also indicated. The scale, assuming a distance of 11.2 kpc is indicated in the bottom right corner. |
| In the text | |
|
Fig. 4 Left: same as Fig. 3 for IRAS 19422+3506. All channels with a S/N> 15 are plotted. Positional uncertainties for the individuals spots range from ~2 mas to ~30 mas for the strongest and weakest plotted masers, respectively. No average offset is detected between the red- and blue-shifted masers. Right: similar to the left but only spots with S/N> 50 are plotted to highlight the northwest extension of the red-shifted masers. Individual errors range from ~2 mas to ~10 mas. |
| In the text | |
|
Fig. 5 Left: same as Fig. 3 for the remaining source in the sample. Depending on maser flux, different S/N cutoffs are used. For IRAS 19067+0611 all channels with S/N> 5 are plotted and error bars range from ~30 to 90 mas. For IRAS 19096+0916+0819 we use S/N> 25 and error bars range from ~5 to 18 mas. For IRAS 19112+0819, S/N> 5 and error bars range from ~25 to 90 mas. For IRAS 19186+0325, S/N> 5 and error bars range from ~75 to 90 mas. Finally, for IRAS 19254+1631, S/N> 10 and error bars range from ~10 to 45 mas. |
| In the text | |
Current usage metrics show cumulative count of Article Views (full-text article views including HTML views, PDF and ePub downloads, according to the available data) and Abstracts Views on Vision4Press platform.
Data correspond to usage on the plateform after 2015. The current usage metrics is available 48-96 hours after online publication and is updated daily on week days.
Initial download of the metrics may take a while.