Fig. 3
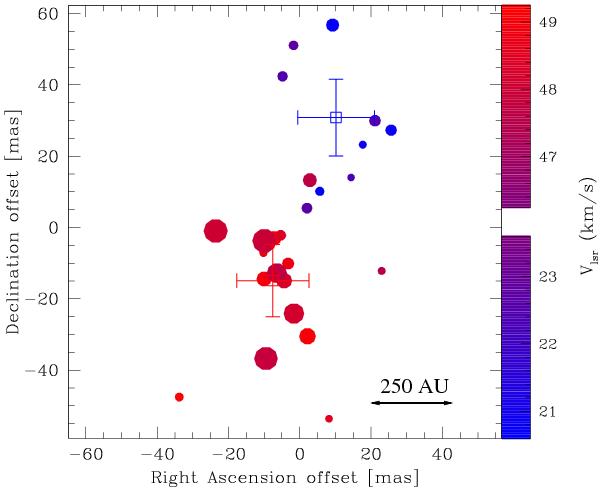
The H2O maser distribution around IRAS 18455+0448 observed with the JVLA. Fits to the centroid position of individual maser velocity channels are potted scaled based on their flux and color coded according to velocity. Only masers detected at a signal-to-noise-ratio >15 are plotted. The positional uncertainties on the individual symbols range from ~15 mas for the brightest to ~30 mas for the weakest features. The error weighted mean positions of the blue- and red-shifted masers with corresponding error bars are also indicated. The scale, assuming a distance of 11.2 kpc is indicated in the bottom right corner.
Current usage metrics show cumulative count of Article Views (full-text article views including HTML views, PDF and ePub downloads, according to the available data) and Abstracts Views on Vision4Press platform.
Data correspond to usage on the plateform after 2015. The current usage metrics is available 48-96 hours after online publication and is updated daily on week days.
Initial download of the metrics may take a while.