Fig. 5
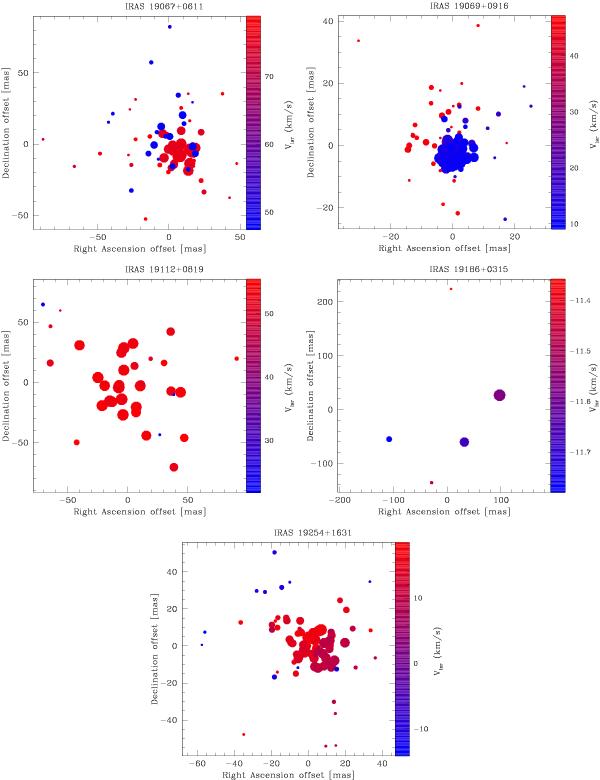
Left: same as Fig. 3 for the remaining source in the sample. Depending on maser flux, different S/N cutoffs are used. For IRAS 19067+0611 all channels with S/N> 5 are plotted and error bars range from ~30 to 90 mas. For IRAS 19096+0916+0819 we use S/N> 25 and error bars range from ~5 to 18 mas. For IRAS 19112+0819, S/N> 5 and error bars range from ~25 to 90 mas. For IRAS 19186+0325, S/N> 5 and error bars range from ~75 to 90 mas. Finally, for IRAS 19254+1631, S/N> 10 and error bars range from ~10 to 45 mas.
Current usage metrics show cumulative count of Article Views (full-text article views including HTML views, PDF and ePub downloads, according to the available data) and Abstracts Views on Vision4Press platform.
Data correspond to usage on the plateform after 2015. The current usage metrics is available 48-96 hours after online publication and is updated daily on week days.
Initial download of the metrics may take a while.