Fig. 4
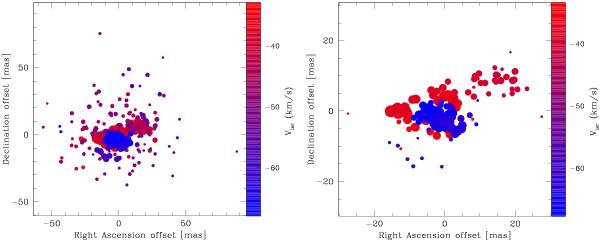
Left: same as Fig. 3 for IRAS 19422+3506. All channels with a S/N> 15 are plotted. Positional uncertainties for the individuals spots range from ~2 mas to ~30 mas for the strongest and weakest plotted masers, respectively. No average offset is detected between the red- and blue-shifted masers. Right: similar to the left but only spots with S/N> 50 are plotted to highlight the northwest extension of the red-shifted masers. Individual errors range from ~2 mas to ~10 mas.
Current usage metrics show cumulative count of Article Views (full-text article views including HTML views, PDF and ePub downloads, according to the available data) and Abstracts Views on Vision4Press platform.
Data correspond to usage on the plateform after 2015. The current usage metrics is available 48-96 hours after online publication and is updated daily on week days.
Initial download of the metrics may take a while.