| Issue |
A&A
Volume 569, September 2014
|
|
|---|---|---|
| Article Number | A9 | |
| Number of page(s) | 15 | |
| Section | Astronomical instrumentation | |
| DOI | https://doi.org/10.1051/0004-6361/201423557 | |
| Published online | 09 September 2014 | |
Performance and calibration of the NIKA camera at the IRAM 30 m telescope
1
Laboratoire de Physique Subatomique et de Cosmologie, Université
Grenoble Alpes, CNRS/IN2P3, 53 rue
des Martyrs, 38026
Grenoble,
France
2
Institut Néel, CNRS and Université de Grenoble,
38042
Grenoble,
France
3
Institut de Planétologie et d’Astrophysique de Grenoble (IPAG),
CNRS and Université de Grenoble, 38041
Grenoble,
France
4
Institut de Radio Astronomie Millimétrique (IRAM),
38406
Grenoble,
France
5 Astronomy Instrumentation Group, University of Cardiff, UK
6
Laboratoire AIM, CEA/IRFU, CNRS/INSU, Université Paris Diderot,
CEA-Saclay, 91191
Gif-Sur-Yvette,
France
7
Institut d’Astrophysique Spatiale (IAS), CNRS and Université Paris
Sud, 91405
Orsay, Cedex France
8
Institut d’Électronique Fondamentale (IEF), Université Paris Sud,
91405
Orsay,
France
9
Institut de Radio Astronomie Millimétrique (IRAM),
18012
Granada,
Spain
10
University College London, Department of Physics and
Astronomy, Gower
Street, London
WC1E 6BT,
UK
11
Università Sapienza di Roma, 00185 Roma Italy
12
SESE and Physics, Arizona State University,
Tempe, AZ, USA
Received:
2
February
2014
Accepted:
20
June
2014
Abstract
The New IRAM KID Array (NIKA) instrument is a dual-band imaging camera operating with kinetic inductance detectors (KID) cooled at 100 mK. NIKA is designed to observe the sky at wavelengths of 1.25 and 2.14 mm from the IRAM 30 m telescope at Pico Veleta with an estimated resolution of 13 arcsec and 18 arcsec, respectively. This work presents the performance of the NIKA camera prior to its opening to the astrophysical community as an IRAM common-user facility in early 2014. NIKA is a test bench for the final NIKA2 instrument to be installed at the end of 2015. The last NIKA observation campaigns on November 2012 and June 2013 have been used to evaluate this performance and to improve the control of systematic effects. We discuss here the dynamical tuning of the readout electronics to optimize the KID working point with respect to background changes and the new technique of atmospheric absorption correction. These modifications significantly improve the overall linearity, sensitivity, and absolute calibration performance of NIKA. This is proved on observations of point-like sources for which we obtain a best sensitivity (averaged over all valid detectors) of 40 and 14 mJy s1/2 for optimal weather conditions for the 1.25 and 2.14 mm arrays, respectively. NIKA observations of well known extended sources (DR21 complex and the Horsehead nebula) are presented. This performance makes the NIKA camera a competitive astrophysical instrument.
Key words: methods: observational / submillimeter: general / submillimeter: galaxies / submillimeter: ISM
© ESO, 2014
1. Introduction
New challenges in millimeter-wave astronomy require instruments with a combination of high sensitivity, angular resolution, and mapping speed. These goals demand the development of a new generation of arrays with large number of detectors (see for example Bintley et al. 2010; Staguhn et al. 2008; Niemack et al. 2008; Güsten et al. 2008). Current individual detectors, such as high impedance bolometers (Tauber et al. 2012), are already photon-noise-limited both for space and the ground observations.
One of the possible technologies suitable for scaling up to larger format arrays is the kinetic inductance detector (KID). These detectors are designed to be read out with frequency-division multiplexing with a large multiplex factor from a few hundred to several thousand per readout chain Bourrion et al. (2012a); Swenson et al. (2010) and are relatively simple to fabricate (see for example Day et al. 2003; Doyle et al. 2007). This technological solution has been selected for the NIKA project (Monfardini et al. 2010, 2011) consisting of a dual-band millimeter camera for observations at the 30 m Institut de RadioAstronomie Millimétrique (IRAM) telescope (Pico Veleta, Spain).
The NIKA camera is a 356-pixel instrument conceived as a resident common user instrument and an early technology demonstrator of the competitiveness of KID arrays. NIKA also serves as preparation for NIKA2, a full-scale instrument to be deployed in late 2015 and designed to fill the field of view (FOV) of the IRAM 30 m telescope. The goals of the NIKA instrument are to perform simultaneous observations in two bands (1.25 mm and 2.14 mm) of milliJansky point sources and to map faint extended continuum emission with diffraction-limited resolution and background-limited performance. Achieving these goals will enable the NIKA instrument to be competitive in several astrophysical fields, such as observations from the northern hemisphere of clusters of galaxies detected by Planck via the Sunyaev-Zel’dovich (SZ) effect (Planck and AMI Collaboration Int. II 2013), observations of high redshift galaxies and quasars, detection of early stages of star formation in molecular clouds in our galaxy and mapping of dust and free-free emission in nearby galaxies. In a companion paper, we present the first observation of the thermal SZ effect on clusters of galaxies (Adam et al. 2014). The NIKA camera is now open to the public for observations as of January 2014.
Previous observing campaigns with the NIKA camera have revealed several technical aspects that limited the sensitivity of detectors. Calvo et al. (2013) show how to linearize the KID signal, while another important issue is the working point of the detectors that evolves with time, owing to varying atmospheric conditions, thus producing a loss in response. A dynamical tuning of the readout electronics was developed to optimize the KID working point between two different sky observations. Atmospheric absorption correction is also required, and a dedicated procedure has been developed in order to use the NIKA instrument as a tau-meter.
These improvements were implemented for the last two technical observing campaigns that took place in November 2012 and June 2013. We report here the overall linearity, sensitivity, and absolute calibration of NIKA.
This article is structured as follows: a review of the main characteristics of the NIKA instrument that focuses on the instrumental improvements with respect to the previous observing campaigns, is presented in Sects. 2 and 3. In Sect. 4, we describe the sky observations made with NIKA that allowed us to characterize the focal plane. Section 5 provides a short description of the reduction pipeline used to analyse the data. In Sect. 6 we describe the atmospheric absorption correction method. In Sect. 7, the final performance of NIKA in terms of instrumental noise equivalent flux density (NEFD) is calculated on point-like sources. Finally in Sect. 8 we detail the observations of point sources and extended sources of the last November 2012 (run5) and June 2013 (run6) campaigns.
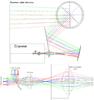 |
Fig. 1 Snapshot from the Zemax simulation used to optimize the optical system of NIKA. In the order of photon travel, the NIKA optics consist of a flat mirror at the top of the cryostat, an off-axis biconic-polynomial curved mirror, a 300 K window lens, a field stop, a 4 K lens, an aperture stop, a dichroic, a 100 mK lens, and two band- defining filters in front of the back-illuminated KID arrays. Top panel: ray tracing from the entrance of the receiver cabin of the 30 m telescope (which is simulated but not shown in the image), view from the elevation axis (which is symbolized by the big circles and contains the 2 mirrors of the Nasmyth system). The NIKA cryostat and entrance nose are represented by the rectangles. Bottom panel: zoomed plot of the optical system inside the NIKA cryostat. The angular size, the beam efficiency and the overall optical efficiency of the system are presented in Table 1. |
2. The NIKA instrument
Cooling the two KID arrays at about 100 mK is the major requirement for driving the architecture of the NIKA instrument. This is achieved by a 4 K cryocooler and a closed-cycle 3He-4He dilution. The optical coupling between the telescope and the detectors is made by warm aluminum mirrors and cold refractive optics. The optics consists of a flat mirror at the top of the cryostat, an off-axis biconic-polynomial curved mirror, a 300 K window lens, a field stop, a 4 K lens, an aperture stop, a dichroic, a 100 mK lens, and two band-defining filters in front of the back-illuminated KID arrays, which have a backshort that matches the corresponding wavelength. A view of the optics of the NIKA instrument and the coupling with the 30 m telescope is presented in Fig. 1. All the elements presented in this figure are real optical elements except for the vertical segment showing the entrance of the receiver cabin and the vertical segments inside the cryostat (field and pupil diaphragms, filters, dichroic and detector arrays).
The throughput of each pixel is calculated using the knowledge of the telescope diameter
and equivalent focus, the fraction of unvignetted pupil defined by the cold field stop, and
the receiver pixel (KID) size with respect to diffraction pattern. Using A for Area, Ω for solid angle, u for pixel size in unit of
Fλ
(λ =
wavelength and F =
f-number or relative aperture), we have:
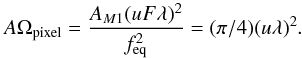 where
AM1 is the effective
primary mirror diameter, and feq the equivalent focal of the telescope.
The effective throughput of the instrument is then AΩeffective = N ∗
AΩpixel, where N is the number of valid
receiver pixels.
where
AM1 is the effective
primary mirror diameter, and feq the equivalent focal of the telescope.
The effective throughput of the instrument is then AΩeffective = N ∗
AΩpixel, where N is the number of valid
receiver pixels.
Characteristics of the NIKA instrument coupled to the IRAM telescope.
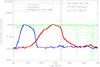 |
Fig. 2 NIKA bandpasses. The bandpass of the 1.25 mm channel (resp. 2.14 mm) is shown in red (resp. blue). The bandpasses are averaged over all valid pixels, with dispersion (rms) of 2% at 1.25 mm and 1% at 2.14 mm. The ATM model calculated for different water vapor contents is presented in green. |
The rejection of out-of-band emission from the sky and the telescope is achieved by using a series of low-pass metal mesh filters, placed at different cryogenic stages in order to minimize the thermal loading on the detectors. This determines the shape, width, and position of each of the NIKA bands. Spectral characterization of the NIKA bandpass was performed using a Martin-Puplett interferometer allowing recovery of the spectral performance of each pixel of the two NIKA channels with uncertenties of a few percent. In Fig. 2 we present the NIKA bandpasses, together with the ATM model calculated for different water vapor contents (Pardo et al. 2002). According to the Pardo model, the 1.25 mm channel is almost sensitive exclusively to the water vapor emission (water vapor secondary line at 183 GHz) in contrast to the 2.14 mm channel, which is slightly sensitive to the roto-vibrational emission line of dioxygen (at 119 GHz). ATM also predicts the contributions of minor species like ozone to the atmospheric absorption. These additional contributions are ignored in this paper. Changing the precipitable water vapor (pwv) content in the ATM model, we can derive the expected sky opacities integrated into the NIKA channels. The ratio between the opacities derived for the 1.25 mm and 2.14 mm channels is obtained not only according to the pseudo continuum emission of the atmosphere (proportional to ν2 where ν represents the electromagnetic frequency) but also taking the contribution of the water vapor emission and dioxygen emission into account. Furthermore, between the 2012 and 2013 observing campaigns we changed (for technical reasons) the cold optical filter chain by adding a low pass filter with a cut-off at 270 GHz. Therefore, we expect to have a different ratio in the derived sky opacities at 1.25 mm and 2.14 mm channels between the two campaigns. From the model, we obtain a ratio between the in-band sky opacities τ(2.14 mm)/τ(1.25 mm) of 0.75 and 0.6 for the 2012 and 2013 observing campaigns, respectively.
2.1. Detector array configurations
The NIKA LEKID detector arrays are made of aluminum and are sensitive to dual polarization. The need to have a symmetric design with a constant filling factor over the whole direct sensitive area drives us to use Hilbert fractal design, which is a well-known geometry for patch antennas (Roesch et al. 2012). The gap of the Al films has been measured thanks to absorption spectra taken in the lab using a Martin-Pupplet interferometer. The measurements show that below roughly 110 GHz, no radiation is absorbed, meaning that the energy gap in the case of 18 nm Al films is approximately 0.2 meV, and the Tc around 1.45 K. The expected film impedance (with respect to the incoming photon able to break Cooper pairs) is actually that of the normal film state. This has been measured to be around 2 Ω/square. This value has been used when designing the detectors to match their effective impedance to that of the incoming radiation (which is absorbed from the substrate side, in a back-illumination configuration).
The results reported in this paper cover two different observing campaigns at the telescope, with slightly different properties of the two focal planes:
-
Campaign 11/2012. During this campaign, referredto as Run 5, the 2.14 mm array is made of 132 pixels with a 20 nm thick Al film on a 300 μm HR silicon substrate. The 1.25 mm array consists of 224 pixels with a film of the same thickness buton a 180 μm substrate. The cold amplifier of the 240 GHz channel showed an unexpectedly low saturation power, so that we could simultaneously readonly eight pixels out with the ideal excitation level or, alternatively, 90 pixels but with a lower power pertone, resulting in suboptimal performance. The number of valid pixels were 100 and 80 for the 2.14 mmand 1.25 mm channels, respectively. The configuration adopted during this observing campaign limited the final sensitivity of the instrument. The channel at 2.14 mm (changed for the 2013 campaign) was limited by the detector noise. For the 1.25 mmchannel, the detectors noise was always relatively flat. This means that the intrinsic frequency noise due to random variations of the effective dielectric is negligible compared to the sky noise. The cold amplifier temperature noise was also negligible compared to the sky noise.
-
Campaign 06/2013. This campaign is referred to as Run 6. For the 2.14 mm channel, we replaced the array with a new one, obtained from a thinner Al film (18 nm), in which we optimized the coupling further to the feedline. We also added bondings across the feedline to suppress spurious slotline modes that were affecting the uniformity of the pixel properties, which led to an increase in the number of valid pixels (Fig. 3). The overall geometry and the pitch between pixels was left unchanged, as was the readout chain. For the 1.25 mm channel, the only intervention was to replace the cold amplifier with a new one having a higher power handling. RF filters have also been added on the readout chain to avoid the harmonics of the local oscillator from reaching the cold amplifier input. Since we suspected that the optical load on the 1.25 mm array was preventing it from cooling down appropriately, we added an additional low-pass edge filter cutting frequencies above 270 GHz, even though this led to the loss of a fraction of the power available in the atmospheric window of interest. The number of valid pixels for this campaign was 125 at 2.14 mm and 190 at 1.25 mm, for a total of 315 pixels. This new configuration was expected to yield a much improved low noise performance, but the bad weather during the observing campaign limited the sensitivity of our arrays. For both channels the dominant noise contribution was due to residual sky noise associated to atmospheric turbulences and residual correlated electronic noise.
For the readout, we used the new NIKEL version 1 electronics, which have worked flawlessly. The boards, described in detail in Bourrion et al. (2012b), are capable of generating up to 400 tones each over a 500 MHz bandwidth. This is achieved by using six separate FPGAs: five of them generate 80 tones each over a 100 MHz band, using five associated DACs. The sixth FPGA acts as a central unit that combines the signal of the other units, apprioprately shifting and filtering the different 100 MHz sub-bands to finally cover the whole 500 MHz available for the frequency comb used to excite the detectors. An analogous, but reversed, process is then applied to the signal acquired by the ADC of the board, which is once again split in five different sub-bands treated separately. Each NIKEL v1 board thus allows us to monitor all the 400 tones simultaneously with a margin of two bits in the 12 bits ADC dynamics.
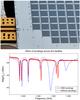 |
Fig. 3 Image of the bondings added across the feedline (top). As can be seen in the frequency sweep carried out before (blue) and after (red) adding the bondings (bottom), the depth of the different resonances has become much more uniform, since the coupling of the resonators to the feedline is no longer affected by the presence of standing waves supported by the slotline modes. Such standing waves were also responsible of the larger dips that are observed before adding the bondings, and they disappear afterwards. |
Data are acquired at a 23.842 Hz rate, synchronously over the two arrays. Binary files are provided as output, which contain the raw data, as well as the resonant frequency of each KID used to set the corresponding excitation tone.
The principal characteristics of the NIKA instrument are presented in Table 1.
3. Readout optimization procedure
In the standard KID readout scheme, each pixel is excited using a fixed tone at its resonant frequency. The signal transmitted past the detector is compared to a reference copy of the excitation signal to get its in-phase (I) and quadrature (Q) components. From these it is then necessary to estimate the corresponding shift in resonance frequency f0 of the detector, because this is the physical property directly related to the incoming optical power: δf0 ∝ δPopt for low values of δPopt (Swenson et al. (2010)). Finding a reliable way to evaluate f0(t) starting from I(t) and Q(t) represents a challenge, and this is especially true in the case of ground-based experiments, as these have to cope with the effects induced by the variations in atmospheric opacity. To improve the photometric reproducibility, we have developed a measurement process which is described in the next subsection.
3.1. Modulated readout
For the NIKA detectors an innovative readout technique has been developed, which has been
succesfully tested during the 2011 run and adopted for all the following campaigns. The
details of this technique are described in Calvo et al.
(2013). Briefly, the underlying idea is to replace the standard excitation of the
detectors, which uses a fixed tone, with a new excitation based on two different
frequencies. We achieve this by modulating the local oscillator signal between two values,
separated by δfLO, in order to
generate two tones, one just above (f+ = f0 +
δfLO/
2) and one just below (f− = f0 −
δfLO /2) the detector resonant
frequency. The modulation is carried out at about 1 kHz, synchronously to the FPGA
sampling of the signal. Thus, each raw data point, which is sent to the acquisition
software at a rate of 23.842 Hz, is composed of the values (I(t),Q(t))
of each pixel, as well as the corresponding differential values 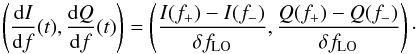 (1)If a variation
(ΔI(t),ΔQ(t))
is observed between successive points, it is possible to estimate the corresponding shift
in the resonant frequency, Δf0(t), by projecting
(ΔI(t),ΔQ(t))
along the gradient found using Eq. (1):
(1)If a variation
(ΔI(t),ΔQ(t))
is observed between successive points, it is possible to estimate the corresponding shift
in the resonant frequency, Δf0(t), by projecting
(ΔI(t),ΔQ(t))
along the gradient found using Eq. (1):
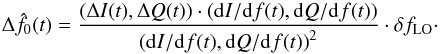 (2)We use the name
RFdIdQ to refer to this estimate of
Δf0.
(2)We use the name
RFdIdQ to refer to this estimate of
Δf0.
3.2. Automated tuning procedure
The modulated readout technique is the core of a fast and effective method of retuning the detectors that we have successfully implemented during the last two campaigns. When operating from ground, the variations in the background load due to the atmosphere can cause the resonant frequency of the detectors to vary by a substantial amount, introducing shifts that can be in some cases greater than the resonances themselves. This effect must be constantly monitored and, if needed, counterbalanced by changing the excitation tones, in order to always match the resonant frequency of each pixel, thus keeping the detectors near to their ideal working point.
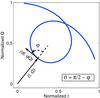 |
Fig. 4 Representation in the I-Q plane of a sweep around a resonance. The measure of the angles ϕ and ϑ can be carried out for each acquired point thanks to the modulated readout technique. On resonance, one gets ϑ = 0. |
The standard solution is that of performing full frequency sweeps before each on-sky observation, leading to a significant loss of observing time. The new tuning method is based on the measurement of the angle ϕ between the vectors (I, Q) and (dI/dfLO, dQ/dfLO), as shown in Fig. 4. Thus, a single data point is now sufficient to retune the detectors without recurring to frequency sweeps. This leads to a crucial advantage in terms of observing time, especially in the case of medium and poor weather conditions. The new procedure reduces the required time for retuning by 75%. Furthermore, in the case of altazimuthal maps, which are always composed of different subscans, the fast-tuning method makes it, in principle, possible to recenter the tones during the time spent by the telescope for changing the direction of its motion at the end of each subscan. Although we still have not made use of this approach, it does not pose any fundamental problem, and might prove highly effective especially in the case of large maps and long integration, in which case the sky conditions can change significantly between the start and the end of an observation.
The tuning process takes place as follows: from the angle ϕ we calculate
ϑ =
π/2−ϕ, so that
the new angle ϑ varies smoothly, decreasing across each resonance
from π to
− π. After
an initial frequency scan has been performed to find the resonances, we fix each
excitation tone where ϑ =
0. At the same time, the slope of the curve ϑ(f),
which is approximately linear around the resonance, is determined as Δϑ/
Δf. Once the tones are fixed, for each tone at
frequency fi it is possible to
continuously monitor the value of ϑi. If the
corresponding resonant frequency  shifts, owing
to changes in the optical load, this directly translates into a variation in
ϑi, from which it is
possible to estimate the actual value of
shifts, owing
to changes in the optical load, this directly translates into a variation in
ϑi, from which it is
possible to estimate the actual value of  as
as 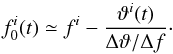 (3)Although this
relationship is not exact, mainly because the changes in the optical load affect the
ϑ(f) relationship and the
corresponding value of Δϑ/Δf, the
results are very accurate, provided that the shift in the resonance frequency does not
exceed the resonance width.
(3)Although this
relationship is not exact, mainly because the changes in the optical load affect the
ϑ(f) relationship and the
corresponding value of Δϑ/Δf, the
results are very accurate, provided that the shift in the resonance frequency does not
exceed the resonance width.
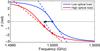 |
Fig. 5 Representation of the tuning technique based on the measurement of ϑ. A sweep (solid
line) is carried out to look for the resonances where ϑ = 0. The tone is
fixed at the corresponding frequency (diamond) and the slope evaluated (dashed
line). If the optical load increases, ϑ changes allowing the appropriate correction
Δfi (black
arrow) to be evaluated. The new tone (circle) will be nearer to the actual position
of the resonant frequency, |
The results can be further improved by iterating the process. For this reason every time
that the telescope is not observing, we activate an automated tuning procedure. This
procedure repeatedly estimates the current value of
for each detector using Eq.
(3), adjusts the corresponding tone
accordingly (Fig. 5), and updates the coefficient
Δϑ/Δf by measuring the value of ϑi just before and just
after changing the frequency fi. Thus taking the
changes in the slope of ϑ(f) into account, the excitation
tone fi rapidly converge to
the correct resonant frequency . The procedure is then halted
as soon as a new observation starts. In preparation for the NIKA open scientific pools, we
will add an automatic check of the distance of each tone from its corresponding resonance.
If this distance increases too much (something that would lead to incorrect data), the
tone is automatically recentered on the resonance. The process is thus not continuous but
only carried out in case of need. Under good sky weather conditions, even very long scans
can be carried out without having to change the tones. This automatic tuning process will
allow astronomers to observe throughout the future campaigns with no interventions of the
supporting NIKA team.
4. Field-of-view (FOV) properties and main beam characterization
The frequency multiplexing of NIKA prevents us from knowing a priori the pointing direction of each detector on the sky. This has to be determined on astronomical observations. We therefore scan a strong astromical source with the entire focal plane. The calibration source, typically a planet (Mars, Uranus, Neptune), is small compared to our beam and can be considered as a point source. Indeed, during the 2012 observing campaign, the angular diameter of Uranus was 3.54 arcsec. The convolution of the corresponding disk with a Gaussian beam of 13.5 and 18.4 arcsec FWHM would broaden our beam by only 0.17 arcsec at 1.25 mm and 0.12 at 2.14 mm.
The source is raster-scanned at 35 arcsec/s, and each subscan is 420 arcsec long, centered on the source as the latter is being tracked by the telescope. This scanning speed provides about 10 and 12 points per FWHM at 1.25 mm and 2.14 mm resp., hence providing excellent beam sampling. To have a clean determination of the beam parameters (position, width, and orientation) of each KID, we proceed in two steps.
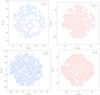 |
Fig. 6 Detector sampling of the FOV at 1.25 mm (left) and 2.14 mm
(right) for the 2012 (top) and 2013
(bottom) observing campaigns. Beam pattern contours have a diameter
of |
-
We apply a median filter of approximately 5 FWHM of width to the detector timelines to subtract most of the atmospheric signal and the low-frequency, correlated electronic noise while preserving most of the planet signal (less than 1% lost at scales smaller than 2.5 ×FWHM). These timelines are then projected onto individual maps per detector, and a Gaussian ellipse is fitted on the source. Centroid position provides a first estimate of the pointing parameters of each pixel. The amplitude of the Gaussian gives a calibration in Jy/Hz, where Hz represents the shift in resonant frequency for each detector. If the atmospheric absorption is known and accounted for, this becomes a determination of the absolute calibration of each detector. If not, this can still be considered as a cross-calibration of KIDs all at once, and they can be combined accordingly into a single map of the source. This map provides the position of the source in sky coordinates.
-
With this information in hand, we can flag out the source in all KID timelines and build a template of the low frequency part of the signal (mostly sky noise and electronics noise) using, at each time, all detectors that are far from the source (typically further than a few beam FWHM, e.g. 30 arcsec). This template is then subtracted from each KID timeline. This leads to a clean determination of the planet signal with no filtering. Timelines are then projected a second time onto individual maps per KID, and a Gaussian elliptical fit provides the final pointing parameters and FWHM estimates.
For illustration, Figs. 6 and 7 show maps of the 1.25 mm and 2.14 mm detector images and the distribution of the determined beam widths for the 2012 and 2013 observing campaigns. Several scans on calibration sources are performed during the campaign to improve on the reconstruction of the pointing. For the 2012 observing campaign, with typically six such scans, we observed a median variation of the detector pointing directions of 3.4 arcsec at 1.25 mm and 3.2 at 2.14 mm. Although beams were observed to be a bit larger and asymmetric during 2013 observing campaign because of the weather conditions1, the number of valid pixels increased and the FOV was almost fully sampled. For the 2012 observing campaign, the average FWHM were 12.3 ± 0.2 arcsec at 1.25 mm and 18.1 ± 0.3 arcsec at 2.14 mm. For the 2013 observing campaign, they were 13.5 ± 0.9 at 1.25 mm and 18.4 ± 0.8 arcsec at 2.14 mm. The combined beam is larger than individual detector beams because of a possible small offset in the reconstructed detector position in the FOV.
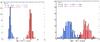 |
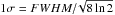
Fig. 7 Beam FWHM distribution at 1.25 (blue) and 2.14 (red) mm for the 2012 (left) and 2013 (right) observing campaigns. The distribution of FWHMs was of lower quality during the 2013 observing campaign owing to poor weather conditions. |
5. Data reduction
As discussed in Sect. 3.1, the NIKA data are acquired at 23.842 Hz, and each pixel is fed a single tone. For each sample and for each KID, the in-phase (I), the quadrature (Q), and their derivatives (dI and dQ) of the transfer function of the feed line and the pixel are recovered. The variation in resonance frequency for each KID in the array is obtained by applying the optimization procedure, RFdIdQ, discussed in Sect. 3.1. We developed a dedicated reduction pipeline to calibrate, filter, and process data onto sky maps. The main steps of the processing are:
-
Read raw: raw data and the main instrumental parameters including FOV reconstruction and atmospheric opacity for each observational scan. The data are ordered per kid and regularly sampled with time. This is called time ordered information (TOI).
-
Flags: bad detectors are flagged based on the frequency range not being large enough to have a low cross-talk level. Noisy or badly systematic, affected detectors are flagged depending on the statistical properties of their noise (such as Gaussianity, stationarity, noise jumps). Saturated and off-tone KIDs are also flagged out.
-
Filtering: frequency lines produced by the vibration of the cryostat pulse tube are flagged and removed with dedicated Fourier space filtering.
Table 2Different contributions to the total calibration error of the NIKA data.
-
Cosmic rays: we detect glitches in the raw data. Since 1.25 mm and 2.14 mm KID arrays are different (in terms of size of the pixels and thickness of the substrate), the rate of observed glitches varies between them. We observe about six glitches/min in the 2.14 mm array and about four for the 1.25 mm array. The observed glitch rate is in good agreement with the expected cosmic ray flux at the IRAM telescope, which is essentially composed by muons with a rate of about 2 events/cm2/min Ramesh et al. (2012). The time response of the KIDs is hundreds of μs, which is negligible compared to the NIKA acquisition rate, therefore each cosmic ray hit only affects only a single sample. Glitches are removed from the TOI by flagging peaks at 5σ level. Then the TOI is linearly interpolated in order not to perturb the decorrelation method. Flagged samples are not projected onto the sky.
-
Calibration of the TOI: the absolute calibration is applied to these TOIs and an atmospheric absorption correction performed (see Sect. 6.2).
-
Atmospheric and electronic noise decorrelation: depending on the scientific target, two basic decorrelation methods have been tested:
-
1) Dual-band decorrelation: spectral decorrelation is performedto recover the diffuse thermal SZ effect (see Adamet al. 2014 for more detail) inclusters of galaxies. We capitalize on the significant difference between the thermal SZ associated signal and the two frequency channels. In particular, at 240 GHz the thermal SZ emission is negligible to first order, and we can use this channel to obtain a template of the atmospheric emission.
-
2) Single-band decorrelation: a sky noise TOI template is produced by averaging all TOIs of a single array. This template is scaled for each detector and subtracted from individual TOIs. Variations on this method have been tested. They involve masking the point source if bright enough, or masking an extended source if detected in a previous iteration of the map-making process or filtering the sky noise template. In particular, we consider an iterative procedure. A first sky map is constructed as discussed above. From this map we construct a mask of the source in the TOI. We construct a new TOI sky noise template, avoiding samples within the mask. Only a few iterations are needed to converge. So far, the electronic noise has not been dealt with. In general, the cross-talk can be due either to resonator coupling or to electronics cross-talk. The residual estimated cross-talk in the data is about 2%. Decorrelation process reduces, or in some case completely removes, the cross-talk. This can limit the sensitivity of the final sky maps. We are currently investigating how to correct for this by relying on the use of measurements at frequencies that are off-resonance.
-
map making: we project and average the TOIs from all KIDs of a same frequency band on a pixelized map. We do not project flagged data, and each detector sample is weighted by the inverse variance of the detector timeline. The latter is estimated far from the source. This weighting scheme does not average down any residual correlated noise coming from the sky, for instance. The error bar on flux measurement that we quote is therefore not computed analytically from these weights but rather from the noise on the map directly. Uncertainties on final maps are also computed.
6. Photometric calibration
The variety of NIKA scientific targets going from thermal SZ observations to dust polarization properties requires an accurate calibration process able to define the impact of systematic errors on the final sky maps as well as possible. The overall calibration uncertainty for point sources on the final data at the map level is estimated to be 15% for the 1.25 mm channel and 10% for 2.14 mm channel. In the following, a list of the principal error sources, which have a direct impact on the total calibration uncertainties, is presented. In Table 2, we quantify these contributions.
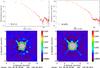 |
Fig. 8 Top panel: radial profile of the NIKA beam pattern (red dots) including the secondary beam contribution for the 1.25 mm channel (left) and 2.14 mm channel (right) in the case of Uranus observations. We are able to measure the beam pattern profile up to scales of about 100 arcsec. At larger distances we do not have enough signal-to-noise. For illustration we also show the NIKA measured primary beam. Bottom panel: map of the far side lobes for 1.25 mm channel (left) and for 2.14 mm channel (right). The maps are derived using observation of Saturn. These maps are compatible with the 2D structure of the beam pattern of the IRAM 30 m telescope described in Greve et al. (1998); Kramer et al. (2013). The diffraction ring seen at 1.25 mm at about 2 arcmin radius, corresponds to the diffraction ring due to panel buckling. The spider supporting the secondary mirror of the telescope is visible to a level of about −30 dB. |
-
Primary calibrator: uranus was selected as the primary calibrator for the NIKA absolute calibration. The absolute calibration factor is derived by fitting a Gaussian of fixed angular size on the reconstructed maps of Uranus. The flux of Uranus is deduced from Moreno (2010); Planck Collaboration VIII (2014) using a frequency-dependent model of the planet brightness temperature and integrating over the NIKA bandpasses. We obtained brightness temperatures of 113 K at 2.14 mm and 94 K at 1.25 mm. This model is accurate at the level of 5%.
-
Elevation dependent gain: the IRAM 30 m telescope has a gain that changes with the elevation. This is because the antenna was not designed in a complete homology way. According to the design and measurements (Greve et al. 1998; Kramer et al. 2013), the peak of the elevation gain curve is obtained for an elevation of 43 degrees. Elevation gain variations have been corrected for in the data analysis.
-
Spectral response: the bandpasses as described in Sect. 2 are obtained as an average of all pixels for each channel. This leads to a contribution to the total calibration error due to the dispersion of the measured bandpasses and to the slightly different response of the pixels.
-
FOV reconstruction: to recover the pointing direction of each pixel, a focal plane reconstruction via planet scans is used. The accuracy of this technique has been described in Sect. 4.
-
Secondary beam fraction: planet observations were used to measure individual pixel primary beams as well as for the FOV reconstruction. The beam width is obtained by fitting a Gaussian on the planet maps. We have observed that variations in the atmospheric conditions lead to changes on the beam width. Since we calibrate assuming a fix beamwidth, these variations induce a systematic error in the final calibration.
-
Opacity correction: the sky maps are corrected for the atmospheric contribution rescaling the observed signal by what that would be obtained in the absence of atmosphere. This is achieved via the elevation scan technique (skydip). The NIKA skydip procedure was successfully tested during the last two NIKA observing campaigns, and it produced a low-level dispersion of the derived opacity at different elevations.
-
Data reduction filtering: the main steps in the data processing have been discussed in Sect. 5. The estimated systematic error introduced by the data reduction filtering (in particular due to the common modes subtraction) is estimated at 5% for both channels. This was computed from the dispersion between different processing modes.
In the following we discuss the secondary beam fraction contribution and the atmospheric absorption correction in more detail.
6.1. Secondary beam fraction
The secondary beam fraction needs to be estimated and accounted for in the case of extended sources. This is known by comparing the NIKA beam pattern with the beam pattern of the 30 m telescope as measured by Kramer et al. (2013, K13) on the Lunar edge using the EMIR receiver. For practical purpose we have divided the beam into three regions: short angular scales correspond to the main beam, intermediate angular scales corresponding to the first error beam, and large angular scales assimilated to far side lobes of the 30 m telescope. To compute the main beam we performed a Gaussian fit to the full observed NIKA beam pattern. The best Gaussian fit is shown in yellow. The NIKA main beam is consistent with the one of K13 because we expect the main beam to be defined by the diameter of the 30 m telescope. In the same way far side lobes, which are expected to come mainly from the second and third error beams of the 30 m telescope caused by small adjustment errors of the panels and their frames, are also consistent between NIKA and K13. However, the first error beam observed in the NIKA beam pattern is larger than the one modeled by K13. This is not unexpected since the observations were carried out at a different time of day and under different weather conditions. In Fig. 8, we show profiles and maps of the beam emphasizing the contribution of the secondary beam for both NIKA channels. The results on the estimation of its contribution are presented in Table 2.
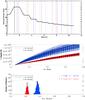 |
Fig. 9 Top panel: telescope positions during an elevation scan procedure: 10 steps in elevation have been performed without changing the azimuthal position. Data for absolute calibration are taken in the region between the blue and the red lines. Middle panel: signal in Hz of each valid KID (blue for 1.25 mm detectors, red for 2.14 mm) as a function of air mass, together with the fitted model (black dotted lines). Bottom panel: deduced integrated in-band opacities for the 1.25 mm and 2.14 mm channels. |
6.2. Atmospheric absorption correction using a Skydip calibration
In the previous observing campaigns, the atmospheric absorption correction was made using the IRAM tau-meter that performs elevation scans continuously at a fixed azimuth at 225 GHz. To derive the opacity at the exact position of the scan and at the same frequencies as NIKA we implemented a procedure that uses the NIKA instrument itself as a tau-meter. For the last 2012 and 2013 observing campaigns, the NIKA atmospheric calibration consisted in measuring the variation in the resonance frequencies of the detectors versus the airmass via elevation scans (skydip Dicke et al. 1946) from 65 to 20 degrees above the horizon. The procedure is based on the idea that the KIDs response (the change in resonant frequency for a given change in absorbed power) is a constant property of each detector. This has been demonstrated in laboratory under realistic conditions (with an optical load changing between about 50 K and 300 K, Monfardini et al. 2014)
During Skydip the telescope performs ten elevation steps each corresponding to variations of 0.18 in air mass. We perform a tuning of the readout electronics before acquiring a useful signal. For each step we have 22 s of useful signal at a given elevation. This is shown in the top plot of Fig. 9 where we present the observed elevation as a function of time during the Skydip procedure.
We expect the acquired useful signal per detector to respond to the airmass as:
![Mathematical equation: \begin{equation} \label{eq:skydip} F^{\rm Ground}_{\rm skydip} = F_0 + C T_{\rm atm}[1 - {\rm{e}}^{- x \tau_{\rm skydip}}]\cdot \end{equation}](/articles/aa/full_html/2014/09/aa23557-14/aa23557-14-eq72.png) (4)Here,
(4)Here,
 is the
acquired signal corresponding to the absolute value of the shift in the frequency tone for
each pixel, F0 is the instrumental offset
corresponding to the frequency tone excitation for the considered pixel for zero opacity,
C the
calibration conversion factor in Hz/K, Tatm (in Kelvin) is the equivalent
temperature of the atmosphere, τskydip the sky opacity during the
skydip (at the wavelength of the fit, either 1.25 or 2.14 mm), x the airmass with
x =
sec(δ) where δ is the average elevation
of the telescope during the scan. By performing a fit of the three parameters,
F0, C, and τ, for all valid detectors
at the same wavelengths, we obtain a common sky opacity at zenith during the skydip. We
can rerun the fit on each detector, assuming the common τ value, and get the
coefficients F0 and C per detector. In the
middle and bottom panels of Fig. 9 we present the
main results of the data analysis of one Skydip performed during the 2013 campaign.
is the
acquired signal corresponding to the absolute value of the shift in the frequency tone for
each pixel, F0 is the instrumental offset
corresponding to the frequency tone excitation for the considered pixel for zero opacity,
C the
calibration conversion factor in Hz/K, Tatm (in Kelvin) is the equivalent
temperature of the atmosphere, τskydip the sky opacity during the
skydip (at the wavelength of the fit, either 1.25 or 2.14 mm), x the airmass with
x =
sec(δ) where δ is the average elevation
of the telescope during the scan. By performing a fit of the three parameters,
F0, C, and τ, for all valid detectors
at the same wavelengths, we obtain a common sky opacity at zenith during the skydip. We
can rerun the fit on each detector, assuming the common τ value, and get the
coefficients F0 and C per detector. In the
middle and bottom panels of Fig. 9 we present the
main results of the data analysis of one Skydip performed during the 2013 campaign.
The F0, C coefficients only depend
on the response of the detectors. Since the non-linearities of the KID frequency signal
are negligible in the considered range of backgrounds, the coefficients can be applied to
all the observing campaign to recover the opacity of the considered scan. This is obtained
by inverting Eq. (4) as: 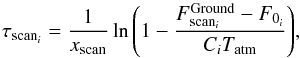 (5)where τscani is
the opacity of the considered scan as measured by a given detector, xscan
corresponds to the air mass at the elevation of the considered scan,
(5)where τscani is
the opacity of the considered scan as measured by a given detector, xscan
corresponds to the air mass at the elevation of the considered scan,
 is the
measured absolute value of the detector resonance frequency during the scan, and
F0i and
Ci are the coefficients
derived from the Skydip technique. The opacity τscan is deduced by averaging
τscani for all valid detectors
at a given wavelength. The brightness of the observed scan map SGround can be
rescaled onto the scale that would be obtained using detectors outside the atmosphere
(SStar) with
is the
measured absolute value of the detector resonance frequency during the scan, and
F0i and
Ci are the coefficients
derived from the Skydip technique. The opacity τscan is deduced by averaging
τscani for all valid detectors
at a given wavelength. The brightness of the observed scan map SGround can be
rescaled onto the scale that would be obtained using detectors outside the atmosphere
(SStar) with
 (6)A initial advantage of
this method is that we do not need to perform the Skydip at the exact time of the source
observations to properly correct the atmospheric contribution in the considered scan. A
second advantage is that we can estimate the atmospheric opacity at the same
(azimuth-elevation) position of the source, instead of the average sky opacity. Finally,
with this method of correcting for the atmospheric absorption, the NIKA bandpasses are
directly taken into account. This method is only limited by the validity of the air-mass
scaling law with elevation (secant model) and by the degeneracy of the atmospheric
temperature with the opacity in our model. To avoid an excessive impact of this
degeneracy, we performed a few Skydip procedures per day of observation.
(6)A initial advantage of
this method is that we do not need to perform the Skydip at the exact time of the source
observations to properly correct the atmospheric contribution in the considered scan. A
second advantage is that we can estimate the atmospheric opacity at the same
(azimuth-elevation) position of the source, instead of the average sky opacity. Finally,
with this method of correcting for the atmospheric absorption, the NIKA bandpasses are
directly taken into account. This method is only limited by the validity of the air-mass
scaling law with elevation (secant model) and by the degeneracy of the atmospheric
temperature with the opacity in our model. To avoid an excessive impact of this
degeneracy, we performed a few Skydip procedures per day of observation.
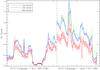 |
Fig. 10 Atmospheric opacity evolution for the NIKA 2012 and 2013 observing campaigns calculated from the Skydip analysis. The error bars were estimated by analysing different Skydip observations. During the 2013 observing campaign, the agreement with 225 GHz IRAM tau-meter is good. |
In Fig. 10 we present the measured opacities for all the mapping scans of the NIKA observing 2012 (top) and 2013 (bottom) campaigns. During the 2012 campaign on 22 and 23 of November, the opacity was less then 0.05 for the 1 mm channel. During the June 2013 campaign, the weather was worse, only permitting proper observations with the 1.25 mm and 2.14 mm channels for about a few hours at the end when the opacity was about 0.1 for the 1.25 mm channel.
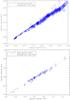 |
Fig. 11 Comparison between the atmospheric opacities measured with the Skydip technique (blue points) and the ATM model (purple lines). The top plot is for the 2012 campaign, the bottom plot for the 2013 campaign. |
6.2.1. Consistency with models
The consistency of the Skydip technique can be validated by using the ATM model (Pardo et al. 2002). We derived the expected opacities integrated into the actual NIKA bandpasses over a range between 0.04 and 20 mm of precipitable water vapor. In Fig. 11 we present the comparison between the opacities derived for 1.25 mm and 2.14 mm channels and the ATM model. The plots at the top present the results for the 2012 observing campaign and the bottom plots results for 2013 observing campaign. The agreement between the measured opacities and the model is good for both campaigns.
7. Noise equivalent flux density (NEFD)
The flux of a point source is measured via a 2D Gaussian fit in the final average map with a fixed width and a fixed position. The fit is linear and involves a constant background, evaluated in a square area with a size of ten times the FWHM of the Gaussian distribution, in our case 13 arcsec (resp. 18 arcsec) at 1.25 mm (resp. 2.14 mm). A photometric correction (of the order of 5%) is applied to the flux measurement to account for the filtering effect induced by the TOI processing.
The noise equivalent flux density (NEFD) is computed as the array-averaged sensitivity to point sources i.e. the flux root mean square (rms) obtained in one second of integration. The average is done via the reciprocal of the square of the NEFD. It takes the time effectively spent by the array on the source into account.
Figure 12 presents the NEFD for each valid KID of the array at 1.25 mm (top) and 2.14 mm (bottom) obtained during the observation of MM18423+5938. In this case, the average sensitivities on the sky are ~48 and ~23 mJy s1/2 at 1.25 and 2.14 mm, respectively. We note that the sensitivity distribution variation across the array is quite large with the majority of detectors concentrated at the better sensitivity end. If we consider only the best 20% detectors of each array, then we get an average NEFD of 39 and 15 mJy s1/2.
NIKA Flux and sensitivity of a collection of point sources.
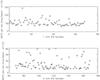 |
Fig. 12 NEFD distribution for the two arrays (1.25 mm top, 2.14 mm bottom) during the 2012 observation campaign, for the MM18423 scans. The detector sensitivity is presented as a function of the KID number, sorted according to the resonance frequency. The average NEFD of the two arrays are 48 and 23 mJy s1/2 at 1.25 and 2.14 mm, respectively, for these observations. If we consider only the best 20% detectors of each array, then we get an average NEFD of 39 and 15 mJy s1/2. |
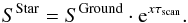
Figure 13 presents the array-averaged NEFD of the NIKA camera at 1.25 and 2.14 mm as a function of the line-of-sight opacity τ/sin(δ), where τ is the zenith opacity and δ the elevation. The NEFD measurements are obtained during the observations described in Table 3. At zero zenith opacity, the array-averaged NEFD are ~40 and ~23 mJy s1/2 at 1.25 and 2.14 mm, respectively, which give an indication of the performance of the 2012 NIKA camera in optimal weather conditions. As expected, the sensitivities degrade with increasing opacity, corresponding to worse weather conditions. At 2.14 mm, we observe, as expected, a degradation due to the opacity effect, following exp(τ/sin(δ)), while the degradation seems to be enhanced at 1.25 mm. Nevertheless, the sky noise decorrelation seems to work in those cases as well. We therefore confirm that the increased power on kids somehow reduces their performance.
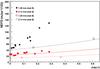 |
Fig. 13 Array-averaged NEFD as a function of the line-of-sight opacity τ/ sin(δ). Black dots (resp. red squares) refer to the 1.25 mm array (resp. 2.14 mm) for the 2012 observation campaign, during which the trend at 2.14 mm is compatible with a exp(τ/ sin(δ)) behavior (as shown with the red curve), while a departure from this behavior is observed at 1.25 mm. The latter can be attributed to the degradation of the KID resonance quality factor with increasing power load. Open circles (resp. open squares) refer to the 1.25 mm array (resp. 2.14 mm) for the 2013 observation campaign. Very few points have been measured, but the achieved sensivities are much better and do follow an expected exponential trend. |
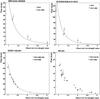 |
Fig. 14 SED of selected pointlike sources observed with NIKA 2012 and 2013 observation campaigns, flux (mJy) as a function of the observed wavelength (mm). Upper left : MM18423+5938 observed by NIKA 2012 observation campaign (red points) and previous millimeter observations (black points; Lestrade et al. 2010). Solid line indicates a modified grey body with β = 1.5 and T = 24 K, (see McKean et al. 2011). Upper right: HLSJ091828.6+514223 observed by NIKA 2012 observation campaign (red points) and previous millimeter observations (black points), (see Combes et al. 2012) and references therein. Solid line indicates a modified grey body with β = 2 and T = 52 K, see (Combes et al. 2012). Lower left: SXDF1100.001 observed by NIKA 2012 observation campaign (red points) and previous millimeter observations (black points), (see Ikarashi et al. 2011) and references therein. Solid line indicates a modified grey body with β = 1.9 and T = 20 K, (see Ikarashi et al. 2011). Lower right: HFLS3 observed by NIKA 2012 observsation campaign (red points) and previous millimeter observations (black points), (see Riechers et al. 2013) and references therein. |
The sensitivity at 1.25 mm was limited by a saturation effect on the readout electronics, which has been corrected since. By only using eight detectors, we have been able to detect the faint source MM18423. In that case, the measured, averaged 1.25 mm NEFD is 27 mJy s1/2 to be compared with 48 mJy s1/2 for the full-array observation (Fig. 12).
SXDF1100.001 has been observed twice during this observation campaign, with two different integration times (68 and 258 min), and we used it to have a first estimate of the evolution of NEFD and noise with integration time. We note that the noise integrates down because the NEFD is stable, and the noise is divided by a factor 2 when increasing the integration time by a factor 4.
The 2013 observation campaign allowed us to test new arrays. Although an additional filter has limited the 1.25 mm band efficiency, we were able to measure the array-averaged NEFD for two sources (HFLS3 and MM18423) in weather conditions far from optimal (τ up to 0.6). As shown in Fig. 13, the achieved sensivities are much better (about 1/3 lower) and do follow an expected exponential trend. We extrapolate a sensitivity at zero zenith opacity of ~40 mJy s1/2 at 1.25 mm and ~14 at 2.14 mm. This improvement is related to technological parameters optimization as explained in Sect. 2.1.
In conclusion, the NIKA instrument has shown an array-averaged NEFD on the sky for point sources of 40 and 14 mJy s1/2 at 1.25 and 2.14 mm in optimal weather conditions. If we consider typical NIKA observing conditions (zenith opacity = 0.1, air mass = 1.5) the array-averaged NEFD results 46 mJy s1/2 at 1.25 mm channel and 15 mJy s1/2 at 2.14 mm channel. Hower, we expect the 1.25 mm channel sensitivity to be improved in the next observation campaigns.
8. NIKA observations
The NIKA camera was used during the November 2012 and June 2013 campaigns to observe point like sources, in order to assess the NIKA photometry, and extended sources to demonstrate the possibility to reconstruct angular scales up to few arcminute.
8.1. Millimeter spectral energy distribution (SED) of selected point sources
Point-like sources were observed during the good weather conditions in the November 2012 and June 2013 campaigns. They were selected to be faint but detectable, in order to assess the NIKA photometry with fluxes of a few tens of mJy. Table 3 describes the measured point-source fluxes at 1.25 and 2.14 mm. Flux errors are statistical only. The opacity corresponds to a value averaged over the scans. Figure 14 presents the spectral energy distribution (SED) of a selection of four sources observed in the 2012 and 2013 campaigns and compares it with previous measurements. We note that NIKA observations are in good agreement with previous observations. We have chosen to observe the following point-source high redshift submillimeter galaxies (SMG): MM18423+5938, HLSJ091828.6+514223, SXDF1100.001, and HFLS3. For the two campaigns, the weakest source detected was HFLS3 with a flux of 16 ± 2 mJy at 1.25 mm and 4.0 ± 0.6 mJy at 2.14 mm.
MM18423+5938
MM18423+5938 is a submillimeter galaxy at z = 3.93 discovered serendipitously (Lestrade et al. 2009) in a search for cold debris disks
around M dwarfs with MAMBO-2 at the IRAM 30 m millimeter telescope. Flux densities at 1.2
mm, 2 mm, and 3 mm were measured (Lestrade et al.
2010). The relatively high flux (about 30 mJy at 1 mm) is explained by the fact
that this SMG is gravitationally lensed, as can be assessed by the observation of the CO
emission, which is consistent with a complete Einstein ring with a major axis diameter of
1.4′′ (Lestrade et al. 2011). Figure 14 (upper left) presents the SED of MM18423+5938 with NIKA measurements
and previous ones (Lestrade et al. 2010). J. P.
McKean et al. have fitted the SED with a single temperature modified blackbody spectrum,
with β = 1.5 ±
0.5 and  , although the lack of
measurements at high frequencies allows for a wider range of temperatures (McKean et al. 2011). Since NIKA data are not included
in the fit, we use it to assess the NIKA photometry. It is presented as a solid line in
Fig. 14 (upper left).
, although the lack of
measurements at high frequencies allows for a wider range of temperatures (McKean et al. 2011). Since NIKA data are not included
in the fit, we use it to assess the NIKA photometry. It is presented as a solid line in
Fig. 14 (upper left).
HLSJ091828.6+514223
HLSJ091828.6+514223 is an exceptionnally bright source at millimeter and submillimeter wavelength, discovered behind the z = 0.22 cluster Abell 773 (Combes et al. 2012). It appears to be a strongly lensed submillimeter galaxy (SMG) at a redshift of z = 5.24, the lens being an optical source lying in the neighborhood. It has been measured at 2 mm (IRAM-30 m EMIR), 1.3 mm (SMA), and 0.88 mm (SMA; see Combes et al. 2012 and references therein). Figure 14 (upper right) presents the SED of HLSJ091828.6+514223 with NIKA measurements and previous ones (Combes et al. 2012). F. Combes et al. have fitted the SED with a single temperature modified blackbody spectrum with β = 2 and T = 52 K. As NIKA data are not included in the fit, we use it to assess the NIKA photometry. The SED is presented as a solid line in Fig. 14 (upper right).
SXDF1100.001
SXDF1100.001 (also known as Orochi) is an extremely bright (50 mJy at 1 mm) submillimeter galaxy, discovered in 1.1 mm observations of the Subaru/XMM-Newton Deep Field using AzTEC on ASTE (Ikarashi et al. 2011). It is believed to be a lensed, optically dark SMG lying at z = 3.4 behind a foreground, optically visible (but red) galaxy at z = 1.4.
Main properties of the maps of extended sources: center of the map, integration time, rms noise, and opacity at the two observation frequencies.
Continuum flux densities at millimeter wavelengths have been measured by SMA, Carma, Z-SPEC/CSO, and AzTEC/ASTE (see Ikarashi et al. 2011, and references therein). Figure 14 (lower left) presents the SED of SXDF1100.001 with NIKA measurements. To our knowledge, this is the first measurement at 2 mm. S. Ikarashi et al. have fitted the SED with a single-temperature, modified blackbody spectrum, with β = 1.9 and T = 20 K (Ikarashi et al. 2011). As NIKA data are not included in the fit, we use it to assess the NIKA photometry. It is presented as a solid line in Fig. 14 (lower right).
HFLS3
HFLS3 has been reported as a massive starburst galaxy at redshift 6.34 (Riechers et al. 2013). Continuum emission has been measured over a broad wavelength range, in particular at millimeter wavelengths (Z-Spec, PdBI/IRAM, CARMA/Caltech, Gismo/IRAM-30 m) (see Riechers et al. 2013 and references therein). Figure 14 (lower right) presents the SED of HFLS3 with NIKA measurements, which are in good agreement.
Other observations
These four comparisons of NIKA observations at 1 and 2 mm with previous observations allow us to assess the NIKA photometry. Other observations (shown in the lower part of Table 3) allow probing the diversity of sources and fluxes and measuring the camera performance in various background conditions. In particular, Arp220 (aka IC 4553) is the closest (z = 0.018) ultraluminous infrared galaxy, known to be a merger system composed of a double nucleus. Continuum flux densities at millimeter wavelengths has been measured (Sakamoto et al. 1999; Scoville et al. 1997; Woody et al. 1989) but particular attention must be paid to line contamination due to the prolific molecular line emission. S. Martin et al. have shown that the contamination of molecular emission to the flux constitutes 28% of the overall flux between 203 and 241 GHz (Martín et al. 2011).
HAT084933, HAT133008, PSS2322+1944, and 4C05.19 are high-redshift point sources. GRB121123A is a gamma-ray burst that happened during the 2012 campaign. ZZTauIRS and CX Tau are stars detected by Herschel.
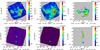 |
Fig. 15 Examples of 1.25 (left) and 2.14 mm (middle) NIKA maps of well-known extended sources. From top to bottom we present the Horsehead nebula and the DR21 OH complex. Spectral index maps are presented in the right column. |
Summary of the NIKA characteristics and performance.
8.2. Mapping of extended sources
During the 2012 and 2013 observation campaigns we observed several well-known extended sources simultaneously at 1 and 2 mm to test the capabilities of the NIKA camera to recover large angular scales up to few arcmin. We performed both elevation and azimuth raster scans to ensure an homogeneous coverage of the mapped area. The size of the scans and integration time have been adapted to each source. We present two examples of extended sources, namely the Horsehead nebula and DR21 OH regions that have been observed during the 2012 campaign. The center pointing position, the size of the scans, and the integration time for each sources are given in Table 4. We also present the median rms of the map and atmospheric opacity for the 1.25 and 2.14 mm maps.
The Horsehead nebula
The Horsehead nebula is a dark protrusion that emerges from the L1630 cloud in the Orion B molecular complex at about 400 pc. This condensation is illuminated by the 09.5 V star σOri which is at a distance of 0.5° from the cloud. It presents a photon-dominated region (PDR) on its western side, which is seen edge-on (Abergel et al. 2003).
We concentrate here on the outer neck (Hily-Blant et al. 2005), which consists of the PDR, the nose, the mane and the jaw. In the top row of Fig. 15, we show the 1.25 (left) and 2.14 (middle) mm NIKA maps. The typical one-sigma error in the map with the pixel size of 3 arcsec is 14.5 mJy/beam at 1.25 mm and 2 at 2.14 mm. The NIKA 1.25 mm is consistent with the 1.2 mm continuum map (Hily-Blant et al. 2005) obtained with MAMBO2, the MPIfR 117-channel bolometer array from 30 m IRAM telescope (Kreysa 1992). In the NIKA maps we clearly observe the PDR region whose morphology changes significantly from one frequency to another. This is also obvious in the spectral index map presented in the right hand figure that ranges between 2 and 5. The northern part of the PDR presents a significantly flatter spectral index (about 4.5) than the southern part and the mane (about 3.5). Two possible explanations are CO 2−1 contamination at 1 mm or high dust emissivity spectral index (Schneider et al. 2013).
DR21 complex
DR21 is a giant star-forming complex located in the constellation Cygnus ~3 kpc from Earth (Campbell et al. 1982; Schneider et al. 2011; Hennemann et al. 2012). H2O masers (Genzel & Downes 1977) and a map of the 1.3 mm continuum emission (Motte et al. 2005) show that DR21 belongs to a north-south oriented chain of massive star forming complexes. DR21 is composed from north to south of three main regions DR21, DR21 OH, and DR21 Main (DR21M). DR21M has a mass of ~20 000 M⊙ and contains one of the most energetic star forming outflows detected to date (Garden et al. 1991a,b; Garden & Carlstrom 1992).
We present in the bottom row of Fig. 15 the NIKA maps of the DR21 complex at 1.25 (left) and 2.14 (right) mm. We observe in them the three main regions in the complex, the most intense being DR21OH and DR21M. As shown in the right hand plot of the row, the spectral characteristics of these two regions are significantly different. DR21M has a flatter spectrum in the frequency range of NIKA. We suspect the presence of strong free-free emission.
9. Conclusion and perspectives
In this paper we have shown that NIKA is a competitive instrument for millimeter wave astronomy using KID detector technology. We presented several instrumental and data analysis improvements including:
-
a reliable optimization of the detectors working point that significantly increased the number of valid detectors and their responsivity;
-
an automatic self atmospheric absorption correction along the line of sight;
-
a data analysis pipeline adapted to KID specifics.
These lead to a significant improvement of the performance in terms of measured NFED and to accurate photometry on point sources.
Table 5 summarizes the main NIKA characteristics and performance as measured on the sky. We obtained a sensitivity (averaged over all valid detectors) of 40 and 14 mJy s1/2 for the best weather conditions for the 1.25 mm and 2.14 mm arrays, respectively, estimated on point like sources. Additionally, the camera performance can be quantified with its mapping speed: the area that can be observed per unit time at a given sensitivity.
The future NIKA2 will be made of about 1000 detectors at 2.14 mm and 2 × 2000 at 1.25 mm with a circular FOV of ~6.5 arcmin diameter. NIKA2 will be commissioned at the end of 2015. In addition the NIKA2 instrument will have linear polarization capabilities at 1.25 mm. The performance in polarization will be tested in the NIKA camera during the 2014 observation campaigns.
Under turbulent sky, the anomalous refraction is larger and spreads the incoming light, hence enlarging the image.
Acknowledgments
We would like to thank the IRAM staff for their support during the campaign. This work has been partially funded by the Foundation Nanoscience Grenoble, the ANR under the contracts MKIDS and NIKA. This work has been partially supported by the LabEx FOCUS ANR-11-LABX-0013. This work has benefited from the support of the European Research Council Advanced Grant ORISTARS under the European Union’s Seventh Framework Program (Grant Agreement No. 291294). The NIKA dilution cryostat was designed and built at the Institut Néel. We acknowledge the crucial contribution of the Cryogenics Group and, in particular, Gregory Garde, Henri Rodenas, and Jean-Paul Leggeri. R.A. would like to thank the ENIGMASS French LabEx for funding this work. B.C. acknowledges support from the CNES post-doctoral fellowship program.
References
- Abergel, A., Teyssier, D., Bernard, J. P. et al. 2003, A&A, 410, 577 [NASA ADS] [CrossRef] [EDP Sciences] [Google Scholar]
- Adam, R., Comis, B., Macias-Perez, J., et al. 2014, A&A, accepted [arXiv:1310.6237] [Google Scholar]
- Bintley, D., Macintosh, M. J., Holland, W. S., et al. 2010, in SPIE Conf. Ser., 7741, 06 [Google Scholar]
- Bourrion, O., Vescovi, C., Bouly, J. L., et al. 2012a, in SPIE Conf. Ser., 8452 [Google Scholar]
- Bourrion, O., Vescovi, C., Bouly, J. L., et al. 2012b, J. Instrument., 7, 7014 [Google Scholar]
- Calvo, M., Roesch, M., Désert, F. X., et al. 2013, A&A, 551, L12 [NASA ADS] [CrossRef] [EDP Sciences] [Google Scholar]
- Campbell, M. F., Niles, D., Nawfel, R., et al. 1982, ApJ, 261, 550 [NASA ADS] [CrossRef] [Google Scholar]
- Combes, F., Rex, M., Rawle, T. D., et al. 2012, A&A, 538, L4 [NASA ADS] [CrossRef] [EDP Sciences] [Google Scholar]
- Day, P. K., LeDuc, H. G., Mazin, B. A., Vayonakis, A., & Zmuidzinas, J. 2003, Nature, 425, 817 [NASA ADS] [CrossRef] [PubMed] [Google Scholar]
- Dicke, R. H., Beringer, R., Kuhl, R. L., & Vane, A. B. 1946, Phys. Rev., 70, 340 [NASA ADS] [CrossRef] [Google Scholar]
- Doyle, S., Naylon, J., Mauskopf, P., Porch, A., & Dunscombe, C. 2007, in Proc. Eighteenth International Symposium on Space Terahertz Technology, ed. A. Karpov, 170 [Google Scholar]
- Garden, R. P., & Carlstrom, J. E. 1992, ApJ, 392, 602 [NASA ADS] [CrossRef] [Google Scholar]
- Garden, R. P., Geballe, T. R., Gatley, I., & Nadeau, D. 1991a, ApJ, 366, 474 [NASA ADS] [CrossRef] [Google Scholar]
- Garden, R. P., Hayashi, M., Hasegawa, T., Gatley, I., & Kaifu, N. 1991b, ApJ, 374, 540 [NASA ADS] [CrossRef] [Google Scholar]
- Genzel, R., & Downes, D. 1977, A&AS, 30, 145 [NASA ADS] [Google Scholar]
- Greve, A., Kramer, C., & Wild, W. 1998, A&AS, 133, 271 [NASA ADS] [CrossRef] [EDP Sciences] [Google Scholar]
- Güsten, R., Baryshev, A., Bell, A., et al. 2008, in SPIE Conf. Ser., 7020, 10 [Google Scholar]
- Hennemann, M., Motte, F., Schneider, N., et al. 2012, A&A, 543, L3 [NASA ADS] [CrossRef] [EDP Sciences] [Google Scholar]
- Hily-Blant, P., Teyssier, D., Philipp, S., & Güsten, R. 2005, A&A, 440, 909 [NASA ADS] [CrossRef] [EDP Sciences] [Google Scholar]
- Ikarashi, S., Kohno, K., Aguirre, J. E., et al. 2011, MNRAS, 415, 3081 [NASA ADS] [CrossRef] [Google Scholar]
- Kramer, C., Penalver, J., & Greve, A. 2013, Internal IRAM Document [Google Scholar]
- Kreysa, E. 1992, in Photon Detectors for Space Instrumentation, eds. T. D. Guyenne, & J. Hunt, ESA SP, 356, 207 [Google Scholar]
- Lestrade, J.-F., Wyatt, M. C., Bertoldi, F., Menten, K. M., & Labaigt, G. 2009, A&A, 506, 1455 [NASA ADS] [CrossRef] [EDP Sciences] [Google Scholar]
- Lestrade, J.-F., Combes, F., Salomé, P., et al. 2010, A&A, 522, L4 [NASA ADS] [CrossRef] [EDP Sciences] [Google Scholar]
- Lestrade, J.-F., Carilli, C. L., Thanjavur, K., et al. 2011, ApJ, 739, L30 [NASA ADS] [CrossRef] [Google Scholar]
- Martín, S., Krips, M., Martín-Pintado, J. E., et al. 2011, A&A, 527, A36 [NASA ADS] [CrossRef] [EDP Sciences] [Google Scholar]
- McKean, J., Alba, A. B., Volino, F., et al. 2011, MNRAS, 414, L11 [NASA ADS] [CrossRef] [Google Scholar]
- Monfardini, A., Swenson, L. J., Bideaud, A., et al. 2010, A&A, 521, A29 [NASA ADS] [CrossRef] [EDP Sciences] [Google Scholar]
- Monfardini, A., Benoit, A., Bideaud, A., et al. 2011, ApJS, 194, 24 [NASA ADS] [CrossRef] [Google Scholar]
- Monfardini, A., Adam, R., Adane, A., et al. 2014, J. Low Temp. Phys., 176, 787 [NASA ADS] [CrossRef] [Google Scholar]
- Moreno, R. 2010, Neptune and Uranus planetary brightness temperature tabulation. Tech. rep., ESA Herschel Science Center, available from ftp://ftp.sciops.esa.int/pub/hsc-calibration/PlanetaryModels/ESA2 [Google Scholar]
- Motte, F., Bontemps, S., Schilke, P., et al. 2005, in Massive Star Birth: A Crossroads of Astrophysics, eds. R. Cesaroni, M. Felli, E. Churchwell, & M. Walmsley, IAU Symp., 227, 151 [Google Scholar]
- Niemack, M. D., Zhao, Y., Wollack, E., et al. 2008, J. Low Temp. Phys., 151, 690 [NASA ADS] [CrossRef] [Google Scholar]
- Pardo, J. R., Cernicharo, J., & Serabyn, E. 2002, IEEE, 49, 1683 [Google Scholar]
- Plank Collaboration VIII. 2014, A&A, in press, DOI: 10.1051/0004-6361/201321538 [Google Scholar]
- Planck and AMI Collaboration Int. II. 2013, A&A, 550, A128 [NASA ADS] [CrossRef] [EDP Sciences] [Google Scholar]
- Ramesh, N., Hawron, M., Martin, C., & Bachri, A. 2012, [arXiv:1203.0101] [Google Scholar]
- Riechers, D. A., Bradford, C. M., Clements, D. L., et al. 2013, Nature, 496, 329 [Google Scholar]
- Roesch, M., Benoit, A., Bideaud, A., et al. 2012, [arXiv:1212.4585] [Google Scholar]
- Sakamoto, K., Scoville, N. Z., Yun, M. S., et al. 1999, ApJ, 514, 68 [NASA ADS] [CrossRef] [Google Scholar]
- Schneider, N., Bontemps, S., Simon, R., et al. 2011, A&A, 529, A1 [NASA ADS] [CrossRef] [EDP Sciences] [Google Scholar]
- Schneider, N., André, P., Könyves, V., et al. 2013, ApJ, 766, L17 [NASA ADS] [CrossRef] [Google Scholar]
- Scoville, N. Z., Yun, M. S., & Bryant, P. M. 1997, ApJ, 484, 702 [NASA ADS] [CrossRef] [Google Scholar]
- Staguhn, J., Allen, C., Benford, D., et al. 2008, J. Low Temp. Phys., 151, 709 [NASA ADS] [CrossRef] [Google Scholar]
- Swenson, L. J., Cruciani, A., Benoit, A., et al. 2010, Appl. Phys. Lett., 96, 263511 [NASA ADS] [CrossRef] [Google Scholar]
- Tauber, J. A., et al. (Planck Collaboration) 2012, Mem. Soc. Astron. It., 83, 72 [NASA ADS] [Google Scholar]
- Woody, D. P., Scott, S. L., Scoville, N. Z., et al. 1989, ApJ, 337, L41 [NASA ADS] [CrossRef] [Google Scholar]
All Tables
Main properties of the maps of extended sources: center of the map, integration time, rms noise, and opacity at the two observation frequencies.
All Figures
|
Fig. 1 Snapshot from the Zemax simulation used to optimize the optical system of NIKA. In the order of photon travel, the NIKA optics consist of a flat mirror at the top of the cryostat, an off-axis biconic-polynomial curved mirror, a 300 K window lens, a field stop, a 4 K lens, an aperture stop, a dichroic, a 100 mK lens, and two band- defining filters in front of the back-illuminated KID arrays. Top panel: ray tracing from the entrance of the receiver cabin of the 30 m telescope (which is simulated but not shown in the image), view from the elevation axis (which is symbolized by the big circles and contains the 2 mirrors of the Nasmyth system). The NIKA cryostat and entrance nose are represented by the rectangles. Bottom panel: zoomed plot of the optical system inside the NIKA cryostat. The angular size, the beam efficiency and the overall optical efficiency of the system are presented in Table 1. |
| In the text | |
|
Fig. 2 NIKA bandpasses. The bandpass of the 1.25 mm channel (resp. 2.14 mm) is shown in red (resp. blue). The bandpasses are averaged over all valid pixels, with dispersion (rms) of 2% at 1.25 mm and 1% at 2.14 mm. The ATM model calculated for different water vapor contents is presented in green. |
| In the text | |
|
Fig. 3 Image of the bondings added across the feedline (top). As can be seen in the frequency sweep carried out before (blue) and after (red) adding the bondings (bottom), the depth of the different resonances has become much more uniform, since the coupling of the resonators to the feedline is no longer affected by the presence of standing waves supported by the slotline modes. Such standing waves were also responsible of the larger dips that are observed before adding the bondings, and they disappear afterwards. |
| In the text | |
|
Fig. 4 Representation in the I-Q plane of a sweep around a resonance. The measure of the angles ϕ and ϑ can be carried out for each acquired point thanks to the modulated readout technique. On resonance, one gets ϑ = 0. |
| In the text | |
|
Fig. 5 Representation of the tuning technique based on the measurement of ϑ. A sweep (solid
line) is carried out to look for the resonances where ϑ = 0. The tone is
fixed at the corresponding frequency (diamond) and the slope evaluated (dashed
line). If the optical load increases, ϑ changes allowing the appropriate correction
Δfi (black
arrow) to be evaluated. The new tone (circle) will be nearer to the actual position
of the resonant frequency, |
| In the text | |
|
Fig. 6 Detector sampling of the FOV at 1.25 mm (left) and 2.14 mm
(right) for the 2012 (top) and 2013
(bottom) observing campaigns. Beam pattern contours have a diameter
of |
| In the text | |
|
Fig. 7 Beam FWHM distribution at 1.25 (blue) and 2.14 (red) mm for the 2012 (left) and 2013 (right) observing campaigns. The distribution of FWHMs was of lower quality during the 2013 observing campaign owing to poor weather conditions. |
| In the text | |
|
Fig. 8 Top panel: radial profile of the NIKA beam pattern (red dots) including the secondary beam contribution for the 1.25 mm channel (left) and 2.14 mm channel (right) in the case of Uranus observations. We are able to measure the beam pattern profile up to scales of about 100 arcsec. At larger distances we do not have enough signal-to-noise. For illustration we also show the NIKA measured primary beam. Bottom panel: map of the far side lobes for 1.25 mm channel (left) and for 2.14 mm channel (right). The maps are derived using observation of Saturn. These maps are compatible with the 2D structure of the beam pattern of the IRAM 30 m telescope described in Greve et al. (1998); Kramer et al. (2013). The diffraction ring seen at 1.25 mm at about 2 arcmin radius, corresponds to the diffraction ring due to panel buckling. The spider supporting the secondary mirror of the telescope is visible to a level of about −30 dB. |
| In the text | |
|
Fig. 9 Top panel: telescope positions during an elevation scan procedure: 10 steps in elevation have been performed without changing the azimuthal position. Data for absolute calibration are taken in the region between the blue and the red lines. Middle panel: signal in Hz of each valid KID (blue for 1.25 mm detectors, red for 2.14 mm) as a function of air mass, together with the fitted model (black dotted lines). Bottom panel: deduced integrated in-band opacities for the 1.25 mm and 2.14 mm channels. |
| In the text | |
|
Fig. 10 Atmospheric opacity evolution for the NIKA 2012 and 2013 observing campaigns calculated from the Skydip analysis. The error bars were estimated by analysing different Skydip observations. During the 2013 observing campaign, the agreement with 225 GHz IRAM tau-meter is good. |
| In the text | |
|
Fig. 11 Comparison between the atmospheric opacities measured with the Skydip technique (blue points) and the ATM model (purple lines). The top plot is for the 2012 campaign, the bottom plot for the 2013 campaign. |
| In the text | |
|
Fig. 12 NEFD distribution for the two arrays (1.25 mm top, 2.14 mm bottom) during the 2012 observation campaign, for the MM18423 scans. The detector sensitivity is presented as a function of the KID number, sorted according to the resonance frequency. The average NEFD of the two arrays are 48 and 23 mJy s1/2 at 1.25 and 2.14 mm, respectively, for these observations. If we consider only the best 20% detectors of each array, then we get an average NEFD of 39 and 15 mJy s1/2. |
| In the text | |
|
Fig. 13 Array-averaged NEFD as a function of the line-of-sight opacity τ/ sin(δ). Black dots (resp. red squares) refer to the 1.25 mm array (resp. 2.14 mm) for the 2012 observation campaign, during which the trend at 2.14 mm is compatible with a exp(τ/ sin(δ)) behavior (as shown with the red curve), while a departure from this behavior is observed at 1.25 mm. The latter can be attributed to the degradation of the KID resonance quality factor with increasing power load. Open circles (resp. open squares) refer to the 1.25 mm array (resp. 2.14 mm) for the 2013 observation campaign. Very few points have been measured, but the achieved sensivities are much better and do follow an expected exponential trend. |
| In the text | |
|
Fig. 14 SED of selected pointlike sources observed with NIKA 2012 and 2013 observation campaigns, flux (mJy) as a function of the observed wavelength (mm). Upper left : MM18423+5938 observed by NIKA 2012 observation campaign (red points) and previous millimeter observations (black points; Lestrade et al. 2010). Solid line indicates a modified grey body with β = 1.5 and T = 24 K, (see McKean et al. 2011). Upper right: HLSJ091828.6+514223 observed by NIKA 2012 observation campaign (red points) and previous millimeter observations (black points), (see Combes et al. 2012) and references therein. Solid line indicates a modified grey body with β = 2 and T = 52 K, see (Combes et al. 2012). Lower left: SXDF1100.001 observed by NIKA 2012 observation campaign (red points) and previous millimeter observations (black points), (see Ikarashi et al. 2011) and references therein. Solid line indicates a modified grey body with β = 1.9 and T = 20 K, (see Ikarashi et al. 2011). Lower right: HFLS3 observed by NIKA 2012 observsation campaign (red points) and previous millimeter observations (black points), (see Riechers et al. 2013) and references therein. |
| In the text | |
|
Fig. 15 Examples of 1.25 (left) and 2.14 mm (middle) NIKA maps of well-known extended sources. From top to bottom we present the Horsehead nebula and the DR21 OH complex. Spectral index maps are presented in the right column. |
| In the text | |
Current usage metrics show cumulative count of Article Views (full-text article views including HTML views, PDF and ePub downloads, according to the available data) and Abstracts Views on Vision4Press platform.
Data correspond to usage on the plateform after 2015. The current usage metrics is available 48-96 hours after online publication and is updated daily on week days.
Initial download of the metrics may take a while.