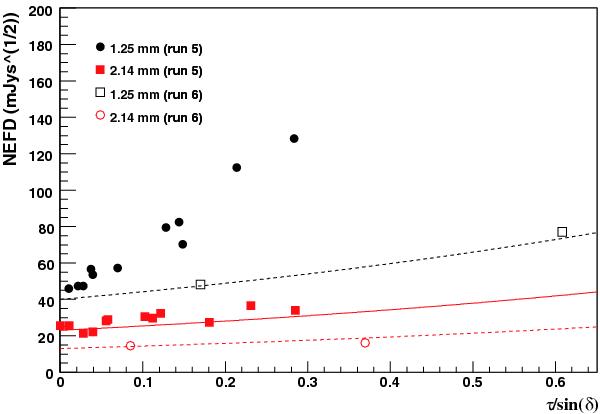
Fig. 13

Array-averaged NEFD as a function of the line-of-sight opacity τ/ sin(δ). Black dots (resp. red squares) refer to the 1.25 mm array (resp. 2.14 mm) for the 2012 observation campaign, during which the trend at 2.14 mm is compatible with a exp(τ/ sin(δ)) behavior (as shown with the red curve), while a departure from this behavior is observed at 1.25 mm. The latter can be attributed to the degradation of the KID resonance quality factor with increasing power load. Open circles (resp. open squares) refer to the 1.25 mm array (resp. 2.14 mm) for the 2013 observation campaign. Very few points have been measured, but the achieved sensivities are much better and do follow an expected exponential trend.
Current usage metrics show cumulative count of Article Views (full-text article views including HTML views, PDF and ePub downloads, according to the available data) and Abstracts Views on Vision4Press platform.
Data correspond to usage on the plateform after 2015. The current usage metrics is available 48-96 hours after online publication and is updated daily on week days.
Initial download of the metrics may take a while.


