| Issue |
A&A
Volume 569, September 2014
|
|
|---|---|---|
| Article Number | A40 | |
| Number of page(s) | 11 | |
| Section | Extragalactic astronomy | |
| DOI | https://doi.org/10.1051/0004-6361/201423367 | |
| Published online | 16 September 2014 | |
Unusual flaring activity in the blazar PKS 1424−418 during 2008−2011
1
Istituto Nazionale di Fisica Nucleare, Sezione di Padova,
35131
Padova, Italy
e-mail:
This email address is being protected from spambots. You need JavaScript enabled to view it.
2
Dipartimento di Fisica e Astronomia “G. Galilei”, Università di
Padova, 35131
Padova,
Italy
3
Istituto Nazionale di Fisica Nucleare, Sezione di
Trieste, 34127
Trieste,
Italy
e-mail:
This email address is being protected from spambots. You need JavaScript enabled to view it.
4
Dipartimento di Fisica, Università di Trieste,
34127
Trieste,
Italy
5
Department of Physics, Stockholm University,
AlbaNova, 106 91
Stockholm,
Sweden
6
The Oskar Klein Centre for Cosmoparticle Physics,
AlbaNova, 106 91
Stockholm,
Sweden
7
Department of Astronomy, Stockholm University,
106 91
Stockholm,
Sweden
8
Agenzia Spaziale Italiana (ASI) Science Data Center, via del
Politecnico, 00133
Roma,
Italy
9
Istituto Nazionale di Astrofisica – Osservatorio Astronomico di
Roma, 00040 Monte Porzio Catone, Roma, Italy
10
Space Science Division, Naval Research Laboratory,
Washington
DC
20375-5352,
USA
11
NASA Goddard Space Flight Center, Greenbelt, MD
20771,
USA
12
INAF Istituto di Radioastronomia, 40129
Bologna,
Italy
13
Center for Research and Exploration in Space Science and
Technology (CRESST) and NASA Goddard Space Flight Center, Greenbelt, MD
20771,
USA
14
Department of Physics and Department of Astronomy, University of
Maryland, College
Park, MD
20742,
USA
15
Landessternwarte, Universitat Heidelberg,
Konigstuhl, 69117
Heidelberg,
Germany
16
Max-Planck-Institut für Radioastronomie,
Auf dem Hügel 69, 53121
Bonn,
Germany
17
The Catholic University of America, 620 Michigan Ave., N.E. Washington, DC
20064,
USA
18
Institut für Theoretische Physik and Astrophysik, Universität
Würzburg, 97074
Würzburg,
Germany
19
Dr. Remeis-Sternwarte Bamberg, Sternwartstrasse 7,
96049
Bamberg,
Germany
20
Erlangen Centre for Astroparticle Physics,
91058
Erlangen,
Germany
21
Universities Space Research Association (USRA),
Columbia, MD
21044,
USA
22
CSIRO Astronomy and Space Science, ATNF, Locked Bag
194, Narrabri
NSW
2390,
Australia
23
School of Mathematics & Physics, Private Bag 37,
University of Tasmania, Hobart
TAS
7001,
Australia
24
CSIRO Astronomy and Space Science, ATNF, PO Box 76,
Epping
NSW
1710,
Australia
25
Harvard-Smithsonian Center for Astrophysics,
Cambridge, MA, USA
26
Space Science Institute, Boulder, CO, USA
27
Jet Propulsion Laboratory, California Institute of
Technology, Pasadena,
CA
91109,
USA
Received:
1
January
2014
Accepted:
28
June
2014
Abstract
Context. Blazars are a subset of active galactic nuclei (AGN) with jets that are oriented along our line of sight. Variability and spectral energy distribution (SED) studies are crucial tools for understanding the physical processes responsible for observed AGN emission.
Aims. We report peculiar behavior in the bright γ-ray blazar PKS 1424−418 and use its strong variability to reveal information about the particle acceleration and interactions in the jet.
Methods. Correlation analysis of the extensive optical coverage by the ATOM telescope and nearly continuous γ-ray coverage by the Fermi Large Area Telescope is combined with broadband, time-dependent modeling of the SED incorporating supplemental information from radio and X-ray observations of this blazar.
Results. We analyse in detail four bright phases at optical-GeV energies. These flares of PKS 1424−418 show high correlation between these energy ranges, with the exception of one large optical flare that coincides with relatively low γ-ray activity. Although the optical/γ-ray behavior of PKS 1424−418 shows variety, the multiwavelength modeling indicates that these differences can largely be explained by changes in the flux and energy spectrum of the electrons in the jet that are radiating. We find that for all flares the SED is adequately represented by a leptonic model that includes inverse Compton emission from external radiation fields with similar parameters.
Conclusions. Detailed studies of individual blazars like PKS 1424−418 during periods of enhanced activity in different wavebands are helping us identify underlying patterns in the physical parameters in this class of AGN.
Key words: galaxies: active / radiation mechanisms: non-thermal / quasars: individual: PKS 1424-418 / gamma rays: galaxies / galaxies: jets
© ESO, 2014
1. Introduction
Blazars are radio-loud active galactic nuclei (AGN) with relativistic jets aligned close to our line of sight (e.g., Blandford & Rees 1978). With very few exceptions (e.g., 4C+55.17; McConville et al. 2011) they exhibit variable emission at all wavelengths, from radio to γ rays, on time scales as short as hours or even minutes (Aharonian et al. 2007, 2009; Aleksić et al. 2011). Their spectral energy distributions (SEDs) in the νFν representation display two broad bumps usually attributed to synchrotron and inverse Compton processes: the first bump is located at infrared-optical frequencies but in some sources it can extend to X-ray frequencies, while the second bump is found at X-ray/γ-ray frequencies. The frequency of the lower energy peak (νsync) has been used to subdivide blazars into three different classes: high, intermediate, and low synchrotron peaked (HSP, ISP and LSP, respectively) depending on whether νsync > 1015 Hz, 1014 Hz < νsync < 1015 Hz or νsync < 1014 Hz (Abdo et al. 2010a). For LSP blazars, especially flat spectrum radio quasars (FSRQs; blazars with strong, broad emission lines) it is common for the optical variations to be correlated with the ~ GeV γ-rays (e.g., Bonning et al. 2009; Chatterjee et al. 2011) indicating that emissions in these wavebands probably originate from the same electron population. This correlated variability reflects what one would expect for a model where the low-energy bump is created by synchrotron emission and the high-energy one is created by Compton scattering of some soft seed photon source. This idea is also reflected in their SEDs, in which the optical emission is generally seen on the decreasing side of the low-energy bump and the GeV γ-rays fall on the decreasing side of the high-energy bump.
Reality, however, can be more complicated; a wide variety of blazar variability behaviors is observed, some of which can be difficult to explain in this simple picture. In some instances for LSPs, the optical and γ-ray components show correlated variability, but the optical has smaller flux variations than the γ rays. This has been interpreted as contamination in the optical band by an underlying accretion disk (Bonning et al. 2009). Although often the γ-ray and optical flares are simultaneous (e.g., Marscher et al. 2010), at other times the optical flare occurs before the γ-ray flare (Marscher et al. 2010) or lags behind the γ-ray flare (Bonning et al. 2009; Abdo et al. 2010c).
In recent years, FSRQ PKS 1424−418 (J1427-4206) has presented an excellent opportunity to use multiwavelength variability as a probe of blazar behavior, for several reasons:
-
1.
The Automatic Telescope for Optical Monitoring(ATOM; Beheraet al. 2009) provides dense opticallight curve coverage for PKS 1424−418.
-
2.
This optical coverage complements the survey mode of the Large Area Telescope (LAT) on the Fermi Gamma-Ray Space Telescope (Atwood et al. 2009).
-
3.
PKS 1424−418 exhibited two major flares in 2009−2010, seen in both optical (Hauser et al. 2009, 2010) and γ-rays (Longo et al. 2009; Donato 2010) and largely isolated from other activity. The clear pattern displayed during the outbursts optimized correlation studies.
-
4.
With mean flux densities over 3 Jy and known variability at multiple radio frequencies (Tingay et al. 2003), PKS 1424−418 is a strong and variable radio source. High resolution Very Long Baseline Interferometry (VLBI) observations of this blazar are being carried out as part of the TANAMI program (Ojha et al. 2010), and radio monitoring is being done as part of the F-GAMMA project (Fuhrmann et al. 2007; Angelakis et al. 2008), the Submillimeter Array (SMA, Gurwell et al. 2007), and other radio telescopes.
-
5.
The instruments on the Swift satellite (Gehrels et al. 2004) have provided additional optical, UV, and X-ray coverage of PKS 1424−418.
PKS 1424−418 has a redshift of z = 1.522 (White et al. 1988) giving it a luminosity distance1 of dL = 11.3 Gpc. Although γ radiation from PKS 1424−418 was reported in the Third EGRET Catalog as 3EG J1429−4217 (Hartman et al. 1999), it was not included in the Fermi LAT Bright Source List, based on data from the first three months of the mission (Abdo et al. 2009). The blazar was then reported in the First (1FGL, Abdo et al. 2010b) and Second (2FGL, Nolan et al. 2012) LAT Catalogs as as 1FGL J1428.2−4204 and 2FGL J1428.0−4206, respectively.
In this work we report the results of the LAT and ATOM monitoring of PKS 1424−418 accompanied by multiwavelength observations across the electromagnetic spectrum. The paper is structured as follows. In Sect. 2 we present the collection of multiwavelength data used in this study. Section 3 describes the multiwavelength light curve, showing the isolated flares that are the focus of this work, while Sect. 4 presents a detailed cross-correlation analysis of the optical and γ-ray data. Section 5 describes the modeling of the broadband SED, and Sect. 6 presents the conclusions.
2. Multiwavelength data
2.1. ATOM optical observations
The 75-cm telescope ATOM (Hauser et al. 2004), located in Namibia, monitors the flux of PKS 1424−418 in two different filters: B (440 nm) and R (640 nm) according to Bessell (1990). ATOM is operated robotically by the High Energy Stereoscopic System (H.E.S.S.) collaboration and obtains automatic observations of confirmed or potentially γ-ray-bright blazars. A 4″ radius aperture is used for both filter bands. Data analysis (debiassing, flat fielding, and photometry with Source-Extractor, Bertin & Arnouts 1996) is conducted automatically using our own pipeline. The ATOM results are shown in panel 3 of Fig. 1, which summarizes the multiwavelength temporal flux behavior of PKS 1424−418.
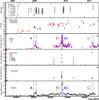 |
Fig. 1 Multiwavelength light curve of PKS 1424−418. From top to bottom: first panel displays radio data from TANAMI in several bands between 4.8 and 40 GHz; second panel displays 230 GHz (red symbols) and 345 GHz (black symbols) data from SMA and APEX, respectively; third panel displays optical B-band (red points) and R-band (green points) data from ATOM, Swift-UVOT data (W1, M2, W2, and V, B, U filters); fourth panel displays Swift-XRT data; fifth panel displays Fermi LAT flux (E> 100 MeV). Vertical lines denote the prominent outbursts studied in this work: black flare A, red flare B1, blue flare B2 and green flare C. |
2.2. Fermi LAT gamma-ray observations
Fermi LAT is a pair-conversion telescope optimized for energies from 20 MeV to greater than 300 GeV (Atwood et al. 2009). Taking advantage of the LAT’s large field of view (~2.4 sr), the Fermi LAT observatory operated in scanning mode provides coverage of the full sky every three hours and offers a good opportunity to follow PKS 1424−418 at γ-ray energies.
We analysed the data sample, which covers observations from 2008 August 4 (MJD 54682) to 2011 June 13 (MJD 55 725), with the standard Fermi Science Tools (version v9r32p5), the P7REP_SOURCE_V15 LAT instrument response functions (IRFs), and associated diffuse emission models2.
The data selection was based on the following criteria. Only good quality P7REP source class events (Bregeon et al. 2013) were extracted from a circular region of interest (ROI) of 10° radius centered at the location of PKS 1424−418 and considered in the analysis. Time intervals when the LAT boresight was rocked with respect to the local zenith by more than 52° (usually for calibration purposes or to point at specific sources) and events with a reconstructed angle with respect to the local zenith >100° were excluded. The latter selection was necessary to limit the contamination from γ-rays produced by interactions of cosmic rays with the upper atmosphere of the Earth. In addition, to correct the calculation of the exposure for the zenith cut, time intervals when any part of the ROI was observed at zenith angles >100° were excluded.
To derive the spectral fluxes we applied an unbinned maximum likelihood technique to events in the energy range from 100 MeV to 300 GeV (Mattox et al. 1996). Sources from the 2FGL catalog (Nolan et al. 2012) located within 15° of PKS 1424−418 were included in the model of the ROI by setting the spectral shapes and the initial parameters for the modeling to those published in the 2FGL catalog. In the fitting procedure the parameters of sources located within a 7° ROI, as well as the normalization of the isotropic background and the Galactic diffuse emission components, were left free to vary. Parameters of sources located between 7° and 15° from the source of interest were instead fixed at their catalog values. Instrumental systematic errors are typically ~10% and negligible compared to the large flux variations observed (Ackermann et al. 2012).
During the LAT observation period, PKS 1424−418 was not always significantly detected. Consequently, we calculated flux upper limits at the 95% confidence level for each time bin where the Test Statistic3 (TS) value for the source was TS < 10 or the number of predicted photons was Npred < 3. The LAT flux results are shown in the bottom panel of Fig. 1. The binning used for the LAT light curves provides a good compromise between sufficient photon statistics and sensitivity to source flux variability. We explored smaller time bins for the flares, but the poor statistics did not allow sufficient detections, even during bright flares.
2.3. Swift observations
The Swift satellite (Gehrels et al. 2004) performed 6 target of opportunity (ToO) observations on PKS 1424−418 in 2010 May, triggered by high optical activity of the source (Hauser et al. 2010), and 2 ToO observations in 2011 May, triggered by the third γ-ray flare observed by Fermi LAT (Szostek 2011). To investigate the source behavior over the years we also analysed three Swift observations carried out before the launch of Fermi LAT (2005 April and 2006 May) and another three observations in 2010 February and September. The observations were made with all three on-board instruments: the UV/Optical Telescope (UVOT; Roming et al. 2005, 170−600 nm), the X-ray Telescope (XRT; Burrows et al. 2005, 0.2−10.0 keV), and the Burst Alert Telescope (BAT; Barthelmy et al. 2005, 15−150 keV). The hard X-ray flux of this source is below the sensitivity of the BAT instrument, not appearing in the 70-month BAT catalog (Baumgartner et al. 2013).
The XRT data were processed with standard procedures (xrtpipeline v0.12.6), filtering, and screening criteria by using the Heasoft package (v.6.11). The source count rate was low during all the observations (count rate <0.5 counts s-1 in the 0.3−10 keV energy range), thus we only considered photon counting data for our analysis, and further selected XRT event grades 0−12. Pile-up correction was not required. Source events were extracted from a circular region with a radius of 20 or 25 pixels (1 pixel ~ 2.36″), depending on the source count rate, while background events were extracted from a circular region with radius 50 pixels and located away from background sources. Ancillary response files were generated with the task xrtmkarf. These account for different extraction regions, vignetting and point spread function corrections. We used the latest version of the spectral redistribution matrices in the calibration database maintained by HEASARC. The adopted energy range for spectral fitting is 0.3−10 keV. We summed two observations performed on 2010 February 11 in order to achieve higher statistics. When the number of counts was fewer than 200 the Cash statistic (Cash 1979) on ungrouped data was used. All the other spectra were rebinned with a minimum of 20 counts per energy bin to allow χ2 fitting within XSPEC (v12.6.0; Arnaud 1996). We fit the individual spectra with a simple absorbed power law, with a neutral hydrogen column density fixed to its Galactic value (NH = 7.71 × 1020 cm-2; Kalberla et al. 2005). The fit results are reported in Table 1.
Fitting results of Swift/XRT observations of PKS 1424−418.
The average X-ray flux observed in 2010 mid-May was higher than the values observed by Swift/XRT in 2005−2006 and 2010 February, indicating an increase in X-ray activity and implying that the flaring mechanism also influences the X-ray band. In particular, an increase of a factor of ~2.5 was observed on 2010 May 14 compared to the 2005−2006 average, at the peak of the X-ray emission, which coincides with flare B. We noted also a change of the spectral index from ~1.4 to ~1.8 during 2010 May. On the other hand, no increase of the X-ray flux was observed after the 2011 May γ-ray flare.
All pointings of UVOT in 2005 and 2006 as well as in 2010 February and September were performed with all 6 UVOT filters (V, B, U, UVW1, UVM2, and UVW2). The remaining observations in 2010 were taken using the “filter of the day”, i.e., either the U or one of the UV filters. In 2011, the source was observed with the V filter only.
We re-processed the UVOT data using the script uvotgrblc, available in version 6.10 of the HEASoft software, and version 20100930 of the UVOT calibration database. The orbits of each UVOT image were summed in order to increase the signal to noise ratio. The photometry was obtained by customizing the background region, selecting an annulus with inner/outer radius of 27′′/35′′, respectively. All field sources that contaminate the background region and appear in any filter have been masked out. The 2005 April pointings had relatively short exposures and the chosen source extraction region was a 3′′-radius circle. Since the source intensity is higher than the values in the remaining observations due to the longer exposures, the radius has been increased to 5′′. The script estimates the photometry by calling the task uvotsource, and the output values are then corrected for aperture effects. Flux values were de-reddened using the values of E(B − V) taken from Schlegel et al. (1998) with Aλ/E(B − V) ratios calculated for the UVOT filters using the mean interstellar extinction curve from Fitzpatrick (1999). The Swift UVOT and XRT results are shown in panel 4 and 5 of Fig. 1.
2.4. Radio data
High resolution Very Long Baseline Interferometry (VLBI) observations of this blazar carried out as part of the TANAMI program show it to have a faint low-surface-brightness jet with a wide opening angle (Ojha et al. 2010). At the milliarcsecond scale, the 22.3 GHz image of PKS 1424−418 (Fig. 2; observed on 2008 March 26) clearly indicates that this source is extremely core dominated at this frequency. This is further confirmed by the 8.4 GHz image in Ojha et al. (2010) which shows a dominant, compact VLBI core and a very diffuse and resolved jet.
Flux densities of the milliarcsecond core of PKS 1424−418.
The milliarcsecond core flux densities of PKS 1424−418 at 8.4 GHz at four epochs during 2008 through 2010 are listed in Table 2. The core flux density declined after the 2008 August epoch and has remained steady during the period covered by the flares. This general trend is seen in the lower resolution radio data as well (see below). The errors in these flux densities are conservatively estimated to be less than 20%. These flux densities were obtained by model fitting a circular Gaussian to the core of VLBI images made by the TANAMI program. For details on the observations, imaging and model fitting process refer to Ojha et al. (2010).
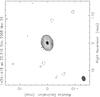 |
Fig. 2 22.3 GHz VLBI image of PKS 1424−418 confirming its core-dominated morphology. The image has a peak flux density of 0.8 Jy/beam. The hatched ellipse on the bottom left represents the synthesized beam of the observing array. |
As part of the TANAMI program, the Australia Telescope Compact Array (ATCA) was used to make “snapshot” observations of PKS 1424−418 at frequencies between 4.8 and 40 GHz. Data at all frequencies were calibrated against the ATCA primary flux calibrator PKS 1934−638 (see Stevens et al. 2012). These flux densities have a 1σ uncertainty of 5, 10 and 15% at 4.8/9.0 GHz, 19 GHz, and 40 GHz, respectively. Each frequency is the center of a 2 GHz wide band. PKS 1424−418 was also monitored at a frequency of 6.7 GHz by the 30-m Ceduna radio telescope in South Australia. Each flux density has a 1 σ uncertainty of ± 0.3 Jy (McCulloch et al. 2005). The lower-frequency radio results from the TANAMI program are shown in the top panel of Fig. 1.
2.5. SMA observations
Observations at 230 GHz (1.3 mm) were obtained at the Submillimeter Array (SMA) near the summit of Mauna Kea (Hawaii). PKS 1424−418 is included in an ongoing monitoring program at the SMA to determine the fluxes of compact extragalactic radio sources that can be used as calibrators at mm wavelengths (Gurwell et al. 2007). PKS 1424−418 was also observed as part of a dedicated program to follow sources on the Fermi LAT Monitored Source List (PI: Wehrle).
These potential calibrators are observed for 3 to 5 min, and the measured source signal strength is calibrated against known standards, typically solar system objects (Titan, Uranus, Neptune, or Callisto). Data from this program are updated regularly and are available at the SMA website4.
2.6. APEX observations
As part of the F-GAMMA program (e.g., Fuhrmann et al. 2007; Angelakis et al. 2008; Angelakis et al. 2012), submm observations of a large sample of Fermi LAT γ-ray blazars including PKS 1424−418 have been performed with the APEX (The Atacama Pathfinder EXperiment) telescope in Chile since early 2008 (see also Larsson et al. 2012). The quasi-regular F-GAMMA observations are obtained during several dedicated time-blocks per year complemented by regular and frequent pointing observations within the framework of other projects and APEX technical time.
The multichannel bolometer array facility instrument LABOCA (Large Apex BOlometer CAmera, Siringo et al. 2008) used for these observations consists of 295 channels arranged in 9 concentric hexagons and operates at a wavelength of 0.87 mm (345 GHz). The observations are typically performed in “spiral observing mode” with a raster of four spiral maps each of 20 or 35 s integration, depending on the source brightness at 345 GHz. During each run, Skydip5 measurements for opacity correction and frequent calibrator measurements are performed (Fuhrmann et al., in prep.). The SMA and APEX flux results are shown in the second panel of Fig. 1.
3. Multiwavelength behavior of the source
The most striking feature of the multiwavelength light curve of Fig. 1 is the series of strong, isolated flares present in the optical and γ-ray bands, seen in the third and bottom panels respectively. At these wavebands the source underwent two main flaring episodes, the first occurring between 2009 June 22 to July 20 (MJD 55 004−55 032; flare A) and the second between 2010 May 6 to 25 (MJD 55 322−55 341; flare B). A third, lower-amplitude flare occurred between 2011 April 19−May 16 (MJD 55 670−55 697; flare C). In both bands, PKS 1424−418 remained in a relatively low state at other times. A detailed analysis of these optical/γ-ray flares is presented in the following section.
Lower-frequency radio flux densities are plotted in the first panel of Fig. 1. Although the radio data indicate that the source has been almost steady during the period of the flares, we note that the Ceduna values (gray points) have quite large error bars, while the sparse sampling of ATCA data may be consistent with some variability, at least on long time scales.
At mm and sub-mm wavelength, the overall sampling displayed in the second panel of Fig. 1 (SMA and APEX data are represented by red and black symbols respectively) is limited, but a strong flux density increase is evident over the observing period of more than two years: the overall flux density increased by a factor of about 3, whereas faster, under-sampled variability is superimposed on the long-term increasing trend.
PKS 1424−418 shows dramatic variability in the X-ray band and in all of the UVOT bands. The data are sparse and do not allow firm conclusions about long term trends but they show that immediately after all three of the γ-ray flares, the optical/UV emission increased as well, when compared with periods of lower γ-ray activity. In particular, the source is ~1−1.5 and ~0.5 mag brighter in 2010 May and 2011 May, respectively, than when observed in 2010 February and September. During the latter periods, the intensity was moderately higher (~0.5 mag) than that observed in 2006 June, and significantly higher (~2 mag) than the very low level recorded in 2005 April. In X-rays, an increase of a factor of 2 in the Swift-XRT flux was seen during 2010 May, in coincidence with the second γ-ray flare.
4. Optical/γ-ray correlation
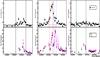 |
Fig. 3 Fermi LAT (2-day bin, top panel) and optical light curves (bottom panel) of PKS 1424−418. The dashed horizontal line in the upper panel indicates the mean γ-ray flux over the whole observing period considered in this work. Vertical lines denote the three prominent outbursts studied in this work: black, flare A (2009 June 22−July 20, MJD 55 004−55 032), red, flare B1 (2010 May 6−16, MJD 55 322−55 332), blue, flare B2 (2010 May 19−25, MJD 55 335−55 341), and green, flare C (2011 April 19−May 16, MJD 55 670−55 697). |
The three main outbursts are clearly visible in the 2-day bin γ-ray light curve and the optical light curves, Fig. 3. Flare A and flare B are displayed with more detail in the upper panels of Figs. 4 and 6, in which the γ-ray light curves (black crosses) have been superimposed onto the optical flux values (pink points).
Close examination of the γ-ray flux evolution during flare B shows a single flaring event. However, in the optical band a two-peak sub-structure is visible during the same time period. In our work, therefore, we study separately the sub-periods and refer to them as flare B1 (2010 May 6−16, MJD 55 322−55 332) and flare B2 (2010 May 19−25; MJD 55 335−55 341).
4.1. Flare A
The shape of flare A is very similar in the optical and γ-ray bands. As can be seen in the upper panel of Fig. 4, not just the peak but also the rising and falling branches seem to track each other fairly well. The main difference between the two bands is a somewhat larger flare amplitude in optical. This is apparent also in the flux ratio plot in the lower panel of Fig. 4, although the comparison is affected by the limited R band sampling during the first part of the flare. The flux ratios were calculated by interpolating the LAT light curve to the times of R-band measurements. To evaluate the ratio, given an optical flux value, we considered two successive LAT flux values, before and after the optical one, and performed a linear interpolation between the two. This interpolated LAT flux is matched with the corresponding R-band measurement.
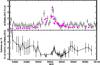 |
Fig. 4 Top panel: comparison of LAT (crosses) and R-band (filled circles) light curves for flare A. Fluxes are rescaled so the mean flux values over the full time range are approximately 1. Bottom panel: flux ratio for the two arbitrarily normalized light curves computed by interpolating LAT fluxes to the times of the R-band measurements. |
Both light curves fluxes were rescaled so the mean flux values over the full time range are approximately 1.
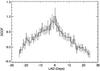 |
Fig. 5 Discrete cross correlation functions for flare A using the ATOM R-band light curve (transformed to flux) and the 1-day bin LAT light curve (>100 MeV). |
The optical/γ-ray correlation was also investigated by calculating the discrete cross correlation functions (DCCF, Edelson & Krolik 1988) between the R band flux and a 1-day binned LAT light curve; this is shown in Fig. 5 for flare A. Approximately 50 days of data were used for the correlation. The DCCF is consistent with zero time lag. From a Gaussian fit we obtain a time lag = −1 ± 2 days, where negative lag means optical leading γ-rays. The uncertainty is based on Monte Carlo simulations taking flux errors and time sampling into account (see Peterson et al. 1998). The rms variations in DCCF values for these Monte Carlo simulations are shown as error bars in the plot, although we note that these errors are strongly correlated: they will make nearby bins in the DCCF move up or down together.
4.2. Flare B
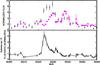 |
Fig. 6 Top panel: comparison of LAT (crosses) and R-band (filled circles) light curves for flare B, Fluxes are rescaled so the mean flux values over the full time range are approximately 1. Bottom panel: flux ratio computed by interpolating LAT fluxes to the times of the R-band measurements as calculated for flare A in Fig. 4. Symbols and normalization are the same as those used for flare A in Fig. 4. |
In contrast to the first flare, Flare B shows large differences between the two bands. Two separate flare components are seen in optical but only one of these has a prominent counterpart in the LAT light curve. The flare onset is also different with a sharp, less than 1 day, increase in γ-rays and a much more gradual brightening in optical. These differences are illustrated by the relative flux of the two bands as plotted in the lower part of Fig. 6, which refers to the period of Flare B and displays in the upper panel the superposition of the optical and γ-ray light curves. The lower panel shows their flux ratios with the same normalization that was applied in Fig. 4.
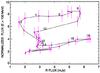 |
Fig. 7 Gamma-ray/optical flux–flux evolution over flare B. LAT 2-day binned fluxes are interpolated to the times of R-band measurements as explained in Sect. 4.1 and plotted on the y-axis. R-band fluxes are plotted on the x-axis. For clarity their errors (typically 5−10% or less) are not shown. Approximate times in days (from MJD 55 322) are indicated along the track. |
For the second flare, the relation between the two bands is more complex than can be described by a single DCCF and cannot be explained by a single time lag. We show in Fig. 7 the flux-flux evolution for flare B. The data points are the same values that were used to compute the flux ratios in Fig. 6. In other words, γ-ray fluxes are interpolated to the times of the R-band observations. Approximate times in days (starting from MJD 55 322) are indicated along the track. The upper loop (days 0−12) in the plot corresponds to the first of the two sub-flares (flare B1; 2010 May 6−16, MJD 55 322−55 332) and the lower part (from day 14) to the second sub-flare (flare B2; 2010 May 19−25, MJD 55 335−55 341), emitting predominantly in the R-band. An interesting feature is that for the rise and decay of the two optical sub-flares, the variation in γ-ray and R-band fluxes can be described by a linear relation with similar slope in all four cases (note, however, the data gap in the R-band during the decay of the first sub-flare).
This behavior can be interpreted as if there are two γ-ray components, one that is directly correlated with optical flux and one that is essentially unrelated (the rise and final drop of the first “sub-flare component”). The former component contributes to both sub-flares, the latter is quiescent during sub-flare B2. Further details are discussed with the SED modeling results in Sect. 5.
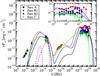 |
Fig. 8 SEDs and model fits for the four flares detected from PKS 1424−418. Simultaneous data for flare A are represented by black symbols, for flare B1 by red symbols, for flare B2 by blue symbols and for flare C by green symbols. The dashed violet lines are the modeled spectra of the dust torus (peaked in the infrared) and accretion disk (peaked in the optical). The solid lines are models of the total emission. The inset shows an enlargement of the LAT spectrum to point out the peculiar concave upwards shape of flares A, B1 and B2. |
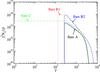 |
Fig. 9 Electron spectra (broken power laws) representing the four different flaring states considered for the source. Details on the parameter values are given in Table 3. |
5. Broad-band spectral energy distribution
We have built four SEDs around the four flare intervals using all multiwavelength data
available. The LAT spectra for flares A, B1 and B2 show a peculiar upwards shape in the SED
representation, although not statistically significant. We modeled each flare with a
leptonic model that includes the synchrotron, synchrotron self-Compton (SSC), and external
Compton (EC) processes. Details of the calculations can be found in Finke et al. (2008) and Dermer et al.
(2009). As is common with blazar SEDs (e.g., D’Ammando et al. 2012), our model fit did not account for the bulk of the observed
radio flux densities. This emission, in the framework of the blazar scenario, must be
produced further down the jet, at relatively large distances from the blazar emission zone.
The SEDs are presented in Fig. 8 and the model
parameters can be found in Table 3. The electron
distribution was assumed to be a broken power-law with a super-exponential cutoff at high
electron Lorentz factor γ′ (in the frame co-moving with the jet:
 for
for
 ). This electron
distribution was chosen to fit the SEDs, and does not necessarily reflect particular
acceleration or cooling processes. Due to the odd concave upwards shape of the LAT spectra
in the SED representation, the source was modeled with two external seed photon sources, one
with parameters similar to what one would expect from a broad line region (BLR, #1), and one
similar to what one would expect from a dust torus (#2). Both sources were modeled as
monochromatic sources that are isotropic in the host frame (i.e., the frame of the host
galaxy and black hole). In the host frame, the sources have energy densities useed,1 and useed,2 and dimensionless
monochromatic energies ϵseed,1 and
ϵseed,2. The four
different electron spectra derived from the modeling for the flares are shown in Fig. 9. The electron spectra needed to be exceptionally narrow
in order to explain the LAT spectra. In general, we attempted to fit as many of the flares
as possible with the same parameters while only varying the electron distribution. We
succeeded in doing this for the flares A, B1, and B2; the only difference in the model for
these flares is the electron distribution. Flares B1 and B2 differ from flare A only by
having a harder spectrum above the break. Flares B1 and B2 differ from each other by flare
B2 having a higher
). This electron
distribution was chosen to fit the SEDs, and does not necessarily reflect particular
acceleration or cooling processes. Due to the odd concave upwards shape of the LAT spectra
in the SED representation, the source was modeled with two external seed photon sources, one
with parameters similar to what one would expect from a broad line region (BLR, #1), and one
similar to what one would expect from a dust torus (#2). Both sources were modeled as
monochromatic sources that are isotropic in the host frame (i.e., the frame of the host
galaxy and black hole). In the host frame, the sources have energy densities useed,1 and useed,2 and dimensionless
monochromatic energies ϵseed,1 and
ϵseed,2. The four
different electron spectra derived from the modeling for the flares are shown in Fig. 9. The electron spectra needed to be exceptionally narrow
in order to explain the LAT spectra. In general, we attempted to fit as many of the flares
as possible with the same parameters while only varying the electron distribution. We
succeeded in doing this for the flares A, B1, and B2; the only difference in the model for
these flares is the electron distribution. Flares B1 and B2 differ from flare A only by
having a harder spectrum above the break. Flares B1 and B2 differ from each other by flare
B2 having a higher  than flare B1.
In this model, this explains why, although flares B1 and B2 have similar optical behavior
and similar flux−flux evolution
(see Fig. 7), flare B2 has lower γ-ray flux than flare B1, as
seen in Fig. 1. Flare C does not show the concave
upwards feature. This flare was modeled with only one external seed photon source, the one
representing the dust torus, and so it represents a flare taking place outside of the BLR.
It also has a lower B and relative to the
models for the other flares. This was possible for flares A, B1 and B2 but not C.
than flare B1.
In this model, this explains why, although flares B1 and B2 have similar optical behavior
and similar flux−flux evolution
(see Fig. 7), flare B2 has lower γ-ray flux than flare B1, as
seen in Fig. 1. Flare C does not show the concave
upwards feature. This flare was modeled with only one external seed photon source, the one
representing the dust torus, and so it represents a flare taking place outside of the BLR.
It also has a lower B and relative to the
models for the other flares. This was possible for flares A, B1 and B2 but not C.
Note that Finke & Dermer (2010) suggested that the LAT spectra of 3C 454.3 can be modeled as a combination of EC from two seed photon sources. In that case, they used the accretion disk and BLR as their photon sources. The unusual shape of the LAT spectra in PKS 1424−418 indicates that a similar combination of seed photon sources can be used to model this source for flares A, B1, and B2, although in this case we use the BLR and dust torus as the sources.
We have also included a model for the accretion disk and dust torus (dashed violet curves in Fig. 8). We used the black hole mass estimate of Fan & Cao (2004; MBH ≈ 4.5 × 10⁹ M⊙) in the accretion disk model, assumed to be a Shakura-Sunyaev disk (Shakura & Sunyaev 1973). There is no evidence for a blue bump in the SED, so the disk was modeled with enough luminosity that a fraction of this could explain the EC seed photon sources. If seed photon source #1 represents the BLR, and the BLR luminosity is related to the BLR radius by the relation LBLR/ (1045 erg s-1) = [ RBLR/ (1017 cm) ] 2 (Ghisellini & Tavecchio 2008), then LBLR/Ldisk ≈ 3 × 10⁻³. We also include an infrared bump representing the dust torus, based on the parameters for seed photon source #2. In this case we assumed a dust temperature Tdust ≈ 800 K and a torus luminosity and radius that follow the relation Ldust/ (1045 erg s-1) = [ Rdust/ (2.5 × 1018 cm) ] 2. With our models this implies Ldust/Ldisk ≈ 0.4.
We have computed the jet powers for the model fits as well (e.g., Celotti & Fabian 1993; Finke et al. 2008), assuming a two-sided jet. For flares A, B1, and B2, the result is quite far from equipartition. The electrons have significantly less energy than the magnetic field, due to the narrow electron spectra needed to fit the concave upwards LAT spectra. Flare C, on the other hand, has no such LAT spectrum, and thus it is possible to fit it with a much broader electron spectrum, and therefore is closer to equipartition. A black hole mass of 4.5 × 10⁹ M⊙ implies an Eddington luminosity of LEdd = 5.7 × 1047 erg s-1, so Ldisk ≈ 0.2LEdd. The jet powers of all of the models are about Pj,tot = Pj,B + Pj,e ≈ 0.3L Edd so it appears approximately the same amount of energy is going into the disk and jet.
6. Summary and conclusions
We have presented multiwavelength observations of PKS 1424−418 during a period of 33 months (2008 August–2011 May) including data from Ceduna, ATCA, SMA, APEX, ATOM, Swift and Fermi LAT. Throughout the overall observing period significant variability is clearly present at optical and γ-ray frequencies, whereas only moderate variability can be noted at radio and sub-mm frequencies. Focusing on the study of the optical and γ-ray behavior of PKS 1424−418, four main flaring phases have been pointed out and analysed in detail. Good correlation is found between these energy bands during all periods with the only exception of one flare (Flare B2).
The relative lack of variability in the VLBI, ATCA and Ceduna data suggests that either the mechanism causing the optical-γ-ray flares is not linked to the radio emission or that there is a delay before changes in radio emission become evident. However, the relatively sparse radio monitoring data means that we cannot rule out radio variability on timescales shorter than the monitoring cadence as is seen in some other blazars (e.g., Richards et al. 2013). The cadence of the Ceduna data is sufficient to rule out significant radio flares on ~100 day timescales.
We complemented the variability investigations building and modeling the SED for flare A, flare B1, flare B2 and flare C. These SEDs were fitted with a leptonic model which included the SSC and EC processes. Based on the unusual LAT spectra for these flares, it appears that the γ-ray emission originates from the scattering of two external seed radiation fields: the dust torus and the BLR. In contrast to all other flare SEDs presented here, the SED of flare C is adequately modeled with only one EC component, the dust torus, and presents a slightly lower magnetic field value. We find that in all outburst states the prevalent source of seed photons is consistent with a dust torus origin (with only about 4% being provided by the BLR). As noted, flare B shows a remarkably complex behavior with a single evident flux increase at γ-rays coincident in time with a double structured flare in the optical band. Similar behavior has already been reported for the blazars 4C +38.41 (Raiteri et al. 2012) and PKS 0208-512. For the latter source Chatterjee et al. (2013) suggested that changes in the magnetic field or in the bulk Lorentz factor could explain the absence of a γ-ray counterpart to the optical outburst. However, the same speculations cannot be applied in the case of PKS 1424−418. Examination of the SEDs and the modeling results show that flares A, B1, and B2 can be explained by varying only the electron distribution. In particular, flares B1 and B2, which displayed different behavior in the optical and γ-ray bands, have approximately the same optical brightening, but flare B1 is brighter in γ-rays. Looking at the γ-ray SEDs though, it can be seen that the LAT spectrum is at the same level for both flare B1 and flare B2, but that flare B2 has lower flux contribution around 0.4 GeV to 2 GeV. Results of the SED modeling indicate that the value of γmin is higher for flare B2 than flare B1: this is the only difference between the two outbursts and the only change needed to explain the difference between these two flaring states.
In conclusion, our investigation of multiple flares of PKS 1424−418 shows that, at least in some objects, major variations in the overall blazar behavior can be explained by changes in the flux and energy spectrum of the particles in the jet that are radiating. In this context, detailed studies of individual blazars like PKS 1424−418 constitute an important opportunity to identify and unveil the fundamental mechanisms at work in blazar physics.
In a flat ΛCDM cosmology where H0 = 67.11 km s-1 Mpc-1, Ωm = 0.3175, and ΩΛ = 0.6825 (Planck Collaboration et al. 2014).
The P7REP data, IRFs, and diffuse models (gll_iem_v05.fit and iso_source_v05.txt) are available at http://fermi.gsfc.nasa.gov/ssc/.
The Test Statistic value quantifies the probability of having a point γ-ray source at the location specified and corresponds roughly to the square of the standard deviation assuming one degree of freedom (Mattox et al. 1996). It is defined as TS = − 2log (L0/L), where L0 is the maximum likelihood value for a model without an additional source (the “null hypothesis”) and L is the maximum likelihood value for a model with the additional source at the specified location.
Skydips are measurements of the sky temperature as a function of airmass and are used to estimate the zenith sky opacity (and so apply to astronomical data for the atmospheric extinction).
Acknowledgments
The Fermi LAT Collaboration acknowledges generous ongoing support from a number of agencies and institutes that have supported both the development and the operation of the LAT as well as scientific data analysis. These include the National Aeronautics and Space Administration and the Department of Energy in the United States, the Commissariat à l’Energie Atomique and the Centre National de la Recherche Scientifique/Institut National de Physique Nucléaire et de Physique des Particules in France, the Agenzia Spaziale Italiana and the Istituto Nazionale di Fisica Nucleare in Italy, the Ministry of Education, Culture, Sports, Science and Technology (MEXT), High Energy Accelerator Research Organization (KEK) and Japan Aerospace Exploration Agency (JAXA) in Japan, and the K. A. Wallenberg Foundation, the Swedish Research Council and the Swedish National Space Board in Sweden. Additional support for science analysis during the operations phase from the following agencies is also gratefully acknowledged: the Istituto Nazionale di Astrofisica in Italy and the K. A. Wallenberg Foundation in Sweden for providing a grant in support of a Royal Swedish Academy of Sciences Research fellowship for J.C. Part of this work was supported by the German Deutsche Forschungsgemeinschaft, DFG project number Ts 17/2–1. The Australian Long Baseline Array and the Australia Telescope Compact Array are part of the Australia Telescope National Facility which is funded by the Commonwealth of Australia for operation as a National Facility managed by CSIRO. The Submillimeter Array is a joint project between the Smithsonian Astrophysical Observatory and the Academia Sinica Institute of Astronomy and Astrophysics and is funded by the Smithsonian Institution and the Academia Sinica. This research was funded in part by NASA through Fermi Guest Investigator grants NNH09ZDA001N and NNH10ZDA001N. This research was supported by an appointment to the NASA Postdoctoral Program at the Goddard Space Flight Center, administered by Oak Ridge Associated Universities through a contract with NASA. We thank Neil Gehrels and the Swift team for scheduling our Target of Opportunity requests. This research was enabled in part through Swift Guest Investigator grants 6090777. We thank Silvia Rainò for useful comments and suggestions.
References
- Abdo, A. A., Ackermann, M., Ajello, M., et al. 2009, ApJS, 183, 46 [NASA ADS] [CrossRef] [Google Scholar]
- Abdo, A. A., Ackermann, M., Agudo, I., et al. 2010a, ApJ, 716, 30 [NASA ADS] [CrossRef] [Google Scholar]
- Abdo, A. A., Ackermann, M., Ajello, M., et al. 2010b, ApJS, 188, 405 [NASA ADS] [CrossRef] [Google Scholar]
- Abdo, A. A., Ackermann, M., Ajello, M., et al. 2010c, Nature, 463, 919 [NASA ADS] [CrossRef] [PubMed] [Google Scholar]
- Ackermann, M., Ajello, M., Allafort, A., et al. 2012, Astropart. Phys., 35, 346 [Google Scholar]
- Aharonian, F., Akhperjanian, A. G., Bazer-Bachi, A. R., et al. 2007, ApJ, 664, L71 [Google Scholar]
- Aharonian, F., Akhperjanian, A. G., Anton, G., et al. 2009, A&A, 502, 749 [NASA ADS] [CrossRef] [EDP Sciences] [Google Scholar]
- Aleksić, J., Antonelli, L. A., Antoranz, P., et al. 2011, ApJ, 730, L8 [NASA ADS] [CrossRef] [Google Scholar]
- Angelakis, E., Fuhrmann, L., Marchili, N., Krichbaum, T. P., & Zensus, J. A. 2008, Mem. Soc. Astron. It., 79, 1042 [NASA ADS] [Google Scholar]
- Angelakis, E., Fuhrmann, L., Nestoras, I., et al. 2012, J. Phys. Conf. Ser., 372, 012007 [NASA ADS] [CrossRef] [Google Scholar]
- Arnaud, K. A. 1996, in Astronomical Data Analysis Software and Systems V, eds. G. H. Jacoby, & J. Barnes, ASP Conf. Ser., 101, 17 [Google Scholar]
- Atwood, W. B., Abdo, A. A., Ackermann, M., et al. 2009, ApJ, 697, 1071 [NASA ADS] [CrossRef] [Google Scholar]
- Barthelmy, S. D., Barbier, L. M., Cummings, J. R., et al. 2005, Space Sci. Rev., 120, 143 [NASA ADS] [CrossRef] [Google Scholar]
- Baumgartner, W. H., Tueller, J., Markwardt, C. B., et al. 2013, ApJS, 207, 19 [NASA ADS] [CrossRef] [EDP Sciences] [Google Scholar]
- Behera, B., Hauser, M., & Wagner, S. J. 2009, 31st ICRC, Lodz, Poland, July 2009 [arXiv:0908.4577] [Google Scholar]
- Bessell, M. S. 1990, PASP, 102, 1181 [NASA ADS] [CrossRef] [Google Scholar]
- Blandford, R. D., & Rees, M. J. 1978, in BL Lac Objects, ed. A. M. Wolfe, 328–341 [Google Scholar]
- Bonning, E. W., Bailyn, C., Urry, C. M., et al. 2009, ApJ, 697, L81 [NASA ADS] [CrossRef] [Google Scholar]
- Bregeon, J., Charles, E., & Wood, M. for the Fermi-LAT collaboration 2013, 2012 Fermi Symposium proceedings – eConf C121028 [arXiv:1304.5456] [Google Scholar]
- Burrows, D. N., Hill, J. E., Nousek, J. A., et al. 2005, Space Sci. Rev., 120, 165 [NASA ADS] [CrossRef] [Google Scholar]
- Cash, W. 1979, ApJ, 228, 939 [NASA ADS] [CrossRef] [Google Scholar]
- Celotti, A., & Fabian, A. C. 1993, MNRAS, 264, 228 [Google Scholar]
- Chatterjee, R., Bailyn, C., Bonning, E., et al. 2011, in AAS Meeting Abstracts, 218, 327.02 [Google Scholar]
- Chatterjee, R., Fossati, G., Urry, C. M., et al. 2013, ApJ, 763, L11 [NASA ADS] [CrossRef] [Google Scholar]
- D’Ammando, F., Rau, A., Schady, P., et al. 2012, MNRAS, 427, 893 [NASA ADS] [CrossRef] [Google Scholar]
- Dermer, C. D., Finke, J. D., Krug, H., & Böttcher, M. 2009, ApJ, 692, 32 [NASA ADS] [CrossRef] [Google Scholar]
- Donato, D. 2010, The Astronomer’s Telegram, 2583, 1 [NASA ADS] [Google Scholar]
- Edelson, R. A., & Krolik, J. H. 1988, in ESA SP, 281, 387 [Google Scholar]
- Fan, Z.-H., & Cao, X. 2004, ApJ, 602, 103 [NASA ADS] [CrossRef] [Google Scholar]
- Finke, J. D., & Dermer, C. D. 2010, ApJ, 714, L303 [NASA ADS] [CrossRef] [Google Scholar]
- Finke, J. D., Dermer, C. D., & Böttcher, M. 2008, ApJ, 686, 181 [NASA ADS] [CrossRef] [Google Scholar]
- Fitzpatrick, E. L. 1999, PASP, 111, 63 [NASA ADS] [CrossRef] [Google Scholar]
- Fuhrmann, L., Zensus, J. A., Krichbaum, T. P., Angelakis, E., & Readhead, A. C. S. 2007, in The First GLAST Symposium, eds. S. Ritz, P. Michelson, & C. A. Meegan, AIP Conf. Ser., 921, 249 [Google Scholar]
- Gehrels, N., Chincarini, G., Giommi, P., et al. 2004, ApJ, 611, 1005 [NASA ADS] [CrossRef] [Google Scholar]
- Ghisellini, G., & Tavecchio, F. 2008, MNRAS, 387, 1669 [NASA ADS] [CrossRef] [Google Scholar]
- Gurwell, M. A., Peck, A. B., Hostler, S. R., Darrah, M. R., & Katz, C. A. 2007, in From Z-Machines to ALMA: (Sub)Millimeter Spectroscopy of Galaxies, eds. A. J. Baker, J. Glenn, A. I. Harris, J. G. Mangum, & M. S. Yun, ASP Conf. Ser., 375, 234 [Google Scholar]
- Hartman, R. C., Bertsch, D. L., Bloom, S. D., et al. 1999, ApJS, 123, 79 [NASA ADS] [CrossRef] [Google Scholar]
- Hauser, M., Möllenhoff, C., Pühlhofer, G., et al. 2004, Astron. Nachr., 325, 659 [Google Scholar]
- Hauser, M., Hagen, H., & Wagner, S. 2009, The Astronomer’s Telegram, 2103, 1 [NASA ADS] [Google Scholar]
- Hauser, M., Hagen, H., & Wagner, S. 2010, The Astronomer’s Telegram, 2613, 1 [NASA ADS] [Google Scholar]
- Kalberla, P. M. W., Burton, W. B., Hartmann, D., et al. 2005, A&A, 440, 775 [NASA ADS] [CrossRef] [EDP Sciences] [Google Scholar]
- Larsson, S., Fuhrmann, L., Weiss, A., et al. 2012, Fermi & Jansky Proceedings, eConf C111110 [arXiv:1206.3799] [Google Scholar]
- Longo, F., Iafrate, G., Hays, E., & Marelli, M. 2009, The Astronomer’s Telegram, 2104, 1 [NASA ADS] [Google Scholar]
- Marscher, A. P., Jorstad, S. G., Larionov, V. M., et al. 2010, ApJ, 710, L126 [NASA ADS] [CrossRef] [Google Scholar]
- Mattox, J. R., Bertsch, D. L., Chiang, J., et al. 1996, ApJ, 461, 396 [NASA ADS] [CrossRef] [Google Scholar]
- McConville, W., Ostorero, L., Moderski, R., et al. 2011, ApJ, 738, 148 [NASA ADS] [CrossRef] [Google Scholar]
- McCulloch, P. M., Ellingsen, S. P., Jauncey, D. L., et al. 2005, AJ, 129, 2034 [NASA ADS] [CrossRef] [Google Scholar]
- Nolan, P. L., Abdo, A. A., Ackermann, M., et al. 2012, ApJS, 199, 31 [NASA ADS] [CrossRef] [Google Scholar]
- Ojha, R., Kadler, M., Böck, M., et al. 2010, A&A, 519, A45 [NASA ADS] [CrossRef] [EDP Sciences] [Google Scholar]
- Peterson, B. M., Wanders, I., Horne, K., et al. 1998, PASP, 110, 660 [NASA ADS] [CrossRef] [Google Scholar]
- Planck Collaboration, XVI. 2014, A&A, in press, DOI: 10.1051/0004-6361/201321591 [Google Scholar]
- Raiteri, C. M., Villata, M., Smith, P. S., et al. 2012, A&A, 545, A48 [NASA ADS] [CrossRef] [EDP Sciences] [Google Scholar]
- Richards, J. L., Hovatta, T., Lister, M. L., et al. 2013, The Innermost Regions of Relativistic Jets and Their Magnetic Fields, Granada, Spain, ed. J. L. Gómez, EPJ Web of Conferences, 61, id. 04010 [Google Scholar]
- Roming, P. W. A., Kennedy, T. E., Mason, K. O., et al. 2005, Space Sci. Rev., 120, 95 [NASA ADS] [CrossRef] [Google Scholar]
- Schlegel, D. J., Finkbeiner, D. P., & Davis, M. 1998, ApJ, 500, 525 [NASA ADS] [CrossRef] [Google Scholar]
- Shakura, N. I., & Sunyaev, R. A. 1973, A&A, 24, 337 [NASA ADS] [Google Scholar]
- Siringo, G., Kreysa, E., Kovacs, A., et al. 2008, in SPIE Conf. Ser., 7020 [Google Scholar]
- Stevens, J., Edwards, P. G., Ojha, R., et al. 2012, Fermi & Jansky Proceedings, eConf C111110 [arXiv:1205.2403] [Google Scholar]
- Szostek, A. 2011, The Astronomer’s Telegram, 3329, 1 [NASA ADS] [Google Scholar]
- Tingay, S. J., Jauncey, D. L., King, E. A., et al. 2003, PASJ, 55, 351 [NASA ADS] [Google Scholar]
- White, G. L., Jauncey, D. L., Wright, A. E., et al. 1988, ApJ, 327, 561 [NASA ADS] [CrossRef] [Google Scholar]
All Tables
All Figures
|
Fig. 1 Multiwavelength light curve of PKS 1424−418. From top to bottom: first panel displays radio data from TANAMI in several bands between 4.8 and 40 GHz; second panel displays 230 GHz (red symbols) and 345 GHz (black symbols) data from SMA and APEX, respectively; third panel displays optical B-band (red points) and R-band (green points) data from ATOM, Swift-UVOT data (W1, M2, W2, and V, B, U filters); fourth panel displays Swift-XRT data; fifth panel displays Fermi LAT flux (E> 100 MeV). Vertical lines denote the prominent outbursts studied in this work: black flare A, red flare B1, blue flare B2 and green flare C. |
| In the text | |
|
Fig. 2 22.3 GHz VLBI image of PKS 1424−418 confirming its core-dominated morphology. The image has a peak flux density of 0.8 Jy/beam. The hatched ellipse on the bottom left represents the synthesized beam of the observing array. |
| In the text | |
|
Fig. 3 Fermi LAT (2-day bin, top panel) and optical light curves (bottom panel) of PKS 1424−418. The dashed horizontal line in the upper panel indicates the mean γ-ray flux over the whole observing period considered in this work. Vertical lines denote the three prominent outbursts studied in this work: black, flare A (2009 June 22−July 20, MJD 55 004−55 032), red, flare B1 (2010 May 6−16, MJD 55 322−55 332), blue, flare B2 (2010 May 19−25, MJD 55 335−55 341), and green, flare C (2011 April 19−May 16, MJD 55 670−55 697). |
| In the text | |
|
Fig. 4 Top panel: comparison of LAT (crosses) and R-band (filled circles) light curves for flare A. Fluxes are rescaled so the mean flux values over the full time range are approximately 1. Bottom panel: flux ratio for the two arbitrarily normalized light curves computed by interpolating LAT fluxes to the times of the R-band measurements. |
| In the text | |
|
Fig. 5 Discrete cross correlation functions for flare A using the ATOM R-band light curve (transformed to flux) and the 1-day bin LAT light curve (>100 MeV). |
| In the text | |
|
Fig. 6 Top panel: comparison of LAT (crosses) and R-band (filled circles) light curves for flare B, Fluxes are rescaled so the mean flux values over the full time range are approximately 1. Bottom panel: flux ratio computed by interpolating LAT fluxes to the times of the R-band measurements as calculated for flare A in Fig. 4. Symbols and normalization are the same as those used for flare A in Fig. 4. |
| In the text | |
|
Fig. 7 Gamma-ray/optical flux–flux evolution over flare B. LAT 2-day binned fluxes are interpolated to the times of R-band measurements as explained in Sect. 4.1 and plotted on the y-axis. R-band fluxes are plotted on the x-axis. For clarity their errors (typically 5−10% or less) are not shown. Approximate times in days (from MJD 55 322) are indicated along the track. |
| In the text | |
|
Fig. 8 SEDs and model fits for the four flares detected from PKS 1424−418. Simultaneous data for flare A are represented by black symbols, for flare B1 by red symbols, for flare B2 by blue symbols and for flare C by green symbols. The dashed violet lines are the modeled spectra of the dust torus (peaked in the infrared) and accretion disk (peaked in the optical). The solid lines are models of the total emission. The inset shows an enlargement of the LAT spectrum to point out the peculiar concave upwards shape of flares A, B1 and B2. |
| In the text | |
|
Fig. 9 Electron spectra (broken power laws) representing the four different flaring states considered for the source. Details on the parameter values are given in Table 3. |
| In the text | |
Current usage metrics show cumulative count of Article Views (full-text article views including HTML views, PDF and ePub downloads, according to the available data) and Abstracts Views on Vision4Press platform.
Data correspond to usage on the plateform after 2015. The current usage metrics is available 48-96 hours after online publication and is updated daily on week days.
Initial download of the metrics may take a while.