Fig. 3
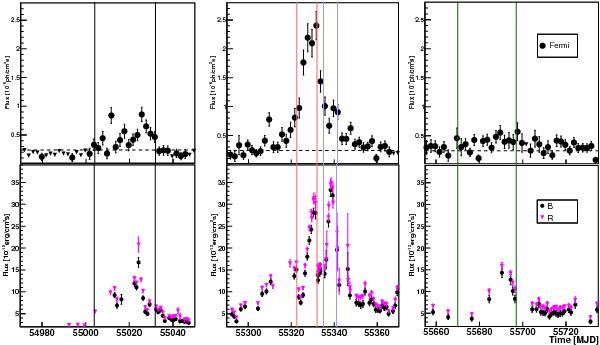
Fermi LAT (2-day bin, top panel) and optical light curves (bottom panel) of PKS 1424−418. The dashed horizontal line in the upper panel indicates the mean γ-ray flux over the whole observing period considered in this work. Vertical lines denote the three prominent outbursts studied in this work: black, flare A (2009 June 22−July 20, MJD 55 004−55 032), red, flare B1 (2010 May 6−16, MJD 55 322−55 332), blue, flare B2 (2010 May 19−25, MJD 55 335−55 341), and green, flare C (2011 April 19−May 16, MJD 55 670−55 697).
Current usage metrics show cumulative count of Article Views (full-text article views including HTML views, PDF and ePub downloads, according to the available data) and Abstracts Views on Vision4Press platform.
Data correspond to usage on the plateform after 2015. The current usage metrics is available 48-96 hours after online publication and is updated daily on week days.
Initial download of the metrics may take a while.