Fig. 6
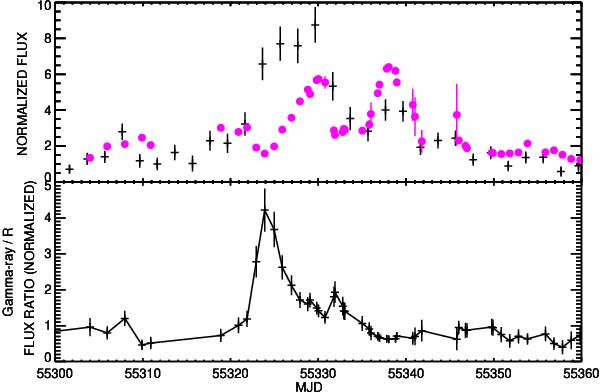
Top panel: comparison of LAT (crosses) and R-band (filled circles) light curves for flare B, Fluxes are rescaled so the mean flux values over the full time range are approximately 1. Bottom panel: flux ratio computed by interpolating LAT fluxes to the times of the R-band measurements as calculated for flare A in Fig. 4. Symbols and normalization are the same as those used for flare A in Fig. 4.
Current usage metrics show cumulative count of Article Views (full-text article views including HTML views, PDF and ePub downloads, according to the available data) and Abstracts Views on Vision4Press platform.
Data correspond to usage on the plateform after 2015. The current usage metrics is available 48-96 hours after online publication and is updated daily on week days.
Initial download of the metrics may take a while.