| Issue |
A&A
Volume 569, September 2014
|
|
|---|---|---|
| Article Number | A96 | |
| Number of page(s) | 17 | |
| Section | Catalogs and data | |
| DOI | https://doi.org/10.1051/0004-6361/201323336 | |
| Published online | 30 September 2014 | |
SEPServer catalogues of solar energetic particle events at 1 AU based on STEREO recordings: 2007–2012
1
IAASARS, National Observatory of Athens,
15236
Penteli,
Greece
e-mail:
This email address is being protected from spambots. You need JavaScript enabled to view it.
2
Christian-Albrechts-Universitaet zu Kiel,
Leibnizstrasse 11,
24118
Kiel,
Germany
3
Observatoire de Paris, Meudon, LESIA-CNRS UMR 8109,
92195
Meudon,
France
4
Department of Physics, POB64, University of
Helsinki, 00014
Helsinki,
Finland
5 Department of Physics and Astronomy, University of Turku,
Finland
6 Department of Physics, University of Ioannina, Greece
7
DH Consultancy BVBA, Leuven, Belgium
8
California Institute of Technology, MC 290-17, Pasadena, CA
91125,
USA
9
SRG, University of Alcalá, 28871
Alcalá de Henares,
Spain
Received:
25
December
2013
Accepted:
8
June
2014
Abstract
The Solar Terrestrial Relations Observatory (STEREO) recordings provide an unprecedented opportunity to study the evolution of solar energetic particle (SEP) events from different observation points in the heliosphere, allowing one to identify the effects of the properties of the interplanetary magnetic field (IMF) and solar wind structures on the interplanetary transport and acceleration of SEPs. Two catalogues based on STEREO recordings, have been compiled as a part of the SEPServer project, a three-year collaborative effort of eleven European partners funded under the Seventh Framework Programme of the European Union (FP7/SPACE). In particular, two instruments on board STEREO have been used to identify all SEP events observed within the descending phase of solar cycle 23 and the rising phase of solar cycle 24 from 2007 to 2012, namely: the Low Energy Telescope (LET) and the Solar Electron Proton Telescope (SEPT). A scan of STEREO/LET protons within the energy range 6–10 MeV has been performed for each of the two STEREO spacecraft. We have tracked all enhancements that have been observed above the background level of this particular channel and cross-checked with available lists of interplanetary coronal mass ejections (ICMEs), stream interaction regions (SIRs), and shocks, as well as with the reported events in literature. Furthermore, parallel scanning of the STEREO near relativistic electrons has been performed in order to pinpoint the presence (or absence) of an electron event in the energy range of 55–85 keV, for all of the aforementioned proton events included in our lists. We provide the onset and peak time as well as the peak value of all events for both protons and electrons, the relevant solar associations in terms of electromagnetic emissions, soft and hard X-rays (SXRs and HXRs). Finally, a subset of events with clear recordings at both STEREO spacecraft is presented together with the parent solar events of these multispacecraft SEP events.
Key words: Sun: particle emission / Sun: heliosphere / Sun: flares / solar-terrestrial relations / Sun: X-rays, gamma rays / catalogs
© ESO, 2014
1. Introduction
SEPServer is a three year collaborative project funded under the Seventh Framework Programme of the European Union1. The implementation of this project aimed at the construction of an Internet server, hosting a number of solar energetic particle (SEP) and electromagnetic (EM) data sets, as well as state-of-the-art analysis methods (Vainio et al. 2013). One of the scientific milestones of SEPServer is the compilation, and release to the SEP community, of multiple SEP event catalogues based on different spacecraft and instruments, covering a broad time range from 1975 to 2012 as well as a variety of radial distances from 0.3 AU to ~5 AU in the heliosphere. In particular, SEPServer hosts six catalogues of SEP events. The Energetic and Relativistic Nuclei and Electron (ERNE) experiment on board the Solar and Heliospheric Observatory (SOHO) was used to compile the first SEPServer catalogue. This was based on the systematic scan of SOHO/ERNE proton intensities (55–80 MeV, or ~68 MeV) observed from 1996–2012 (Vainio et al. 2013). The second SEPServer catalogue utilizes the Kiel Electron Telescope (KET) experiment – one of five telescopes of the COsmic ray and Solar Particle INvestigation (COSPIN) – on board the Ulysses spacecraft. The Ulysses/KET catalogue is based on the systematic scan of proton intensities at 32 <E< 125 MeV, with a parallel scanning of the highest energy channel ranging from 125 <E< 250 MeV, for a time period from 1998–2009 (Heber et al. 2013). For the production of the third and fourth SEPServer catalogues the E6 experiment on board both Helios spacecraft (Helios-A & Helios-B) was used. The Helios (A or B) catalogues are based on the systematic scan of proton intensities at 37 MeV, with a parallel scanning of the integral proton intensities at >51 MeV and electrons at >2 MeV covering a time period from 1975–1982 (for Helios A) and 1977–1980 (for Helios B; Malandraki et al. 2013). This paper presents the fifth and sixth catalogues of SEPServer, based on the recordings of the Solar Terrestrial Relations Observatory (STEREO), covering a time period from 2007 to 2012.
The STEREO mission employs two nearly identical space-based observatories, one ahead of Earth in its orbit (STEREO-A: STA), the other trailing behind (STEREO-B: STB) aimed at providing the first-ever stereoscopic measurements of the Sun (Kaiser et al. 2008). The STEREO mission was set up to explore the causes and mechanisms of coronal mass ejections (CMEs) and to discover the mechanisms and sites of SEP events (Luhmann et al. 2008). During its operational lifetime from the end of 2006, when it was launched, up to the present day, the STEREO spacecraft has provided valuable information on the propagation and acceleration of SEP events.
Case studies of SEP events within the STEREO era vary significantly from one to the other, since the interpretation applied to explain the recordings at different observing points within the heliosphere are fundamentally different. Rouillard et al. (2011) focused on the event of 03 April 2010, demonstrating the shock formation and the connection of the observer’s footpoint to the flanks of the shock. The angular separation between STA and STB was 135°. The authors convincingly linked the observed delays in the onset times and correspondingly the estimated solar release time (SRT) at each observing point within the heliosphere to the evolution of the CME-driven shock. Dresing et al. (2012) investigated the event of 17 January 2010. The separation between STA and STB was 136°. Although none of the spacecraft (i.e., STA, STB, or L1) was magnetically well connected to the flare site, all of them recorded enhancements in the counting rate of protons and electrons with significant delays with respect to the flare onset. Extensive modeling suggested that cross-field diffusion of the particles can provide a reliable explanation for this SEP event. Finally, the analysis of the 07 February 2010 SEP event (Wiedenbeck et al. 2013), where the angular separation was once again 136°, has shown that the particles undergo types of perpendicular transport other than diffusion; for details on this mechanism see Reames (2013) and Tan et al. (2013). For the three aforementioned case studies, with the spacecraft (STA, STB) at almost the same angular separation, different authors have provided three fundamentally different explanations. This highlights the unprecedented opportunity to study the evolution of SEP events at different observing points within the heliosphere, utilizing the STEREO spacecraft, and the capabilities that emerge from the use of these recordings.
An important resource in studies of solar energetic particles are the corresponding SEP event lists, as they usually provide the event characteristic parameters (year, month, day, onset and/or peak time), information on the spacecraft, the species and the energy channels used, and possibly reports on the importance of the SEP event (Vainio et al. 2009). A complete description of an SEP event requires reports on parameters of the parent solar activity that can be associated with each SEP event, the solar source associated with an SEP event identified by the active region number and the coordinates of the flare on the solar disk, and observational data accompanying the source activity (i.e., SXR, HXR bursts in different energy ranges, solar radio emissions, radio bursts; Papaioannou et al. 2013). For L1, based on different spacecraft and different energy channels several comprehensive lists have already been published (Laurenza et al. 2009; Cane et al. 2010; Vainio et al. 2013) whereas others are being maintained at specific websites2. Given the fact that STEREO recordings have been available for only a few years, most efforts have focused on the multispacecraft aspect. As a result, either only a handful of STEREO SEP event lists have been published or specific case studies of SEP events have been presented in the literature. Recently, Lario et al. (2013) presented a comprehensive study of simultaneous measurements of SEP events by two or more of the spacecraft located near 1 AU during the rising phase of solar cycle 24. The authors determined the longitudinal dependence of peak intensities measured in the prompt component of SEP events. They have also presented a table of 35 multispacecraft SEP events, i.e., events that have been recorded on board STA, STB, and near-Earth spacecraft such as ACE, SOHO, and GOES, with a clear signature in protons (25–53 MeV and 15–40 MeV) as well in electrons (71–112 keV and 0.7–3.0 MeV). In a similar study, Dresing et al. (2013), setting the criterion of a minimum longitudinal separation angle of 80° between the source active region at the Sun and the magnetic footpoint of one spacecraft observing the event (i.e., STA, STB, ACE), reported on 19 widespread electron events (65–105 keV) that were observed by at least two spacecraft in the years from 2009 to 2012. Furthermore, Mewaldt et al. (2013), presented a survey of STEREO SEP data identifying 22 SEP events at both STA and STB that satisfied the NOAA criterion of ≥10 protons/(cm2 sr – s) with kinetic energy ≥10 MeV. The authors combined proton data from 10–100 MeV. Twenty SEP events satisfied this criterion at multiple spacecraft (i.e., STA, STB, and GOES), and one to three spacecraft identified a total of 44 separate events during a period of ≈3 years (July 2010 through May 2013). All of the aforementioned studies provide very important statistical information and are a vital part of SEP event research, but at the same time are limited and do not constitute a complete survey based on STEREO recordings.
In this paper we present an attempt to compile a complete survey of SEP events for both STEREO spacecraft (STA & STB) observed within the descending phase of solar cycle 23 and the rising phase of solar cycle 24 from 2007 to 2012. We also perform time-shifting analysis (TSA; Malandraki et al. 2012; Vainio et al. 2013; Papaioannou et al. 2014) for the first arriving particles in order to establish accurate SRT for each event. Finally we link each SEP event with observational data accompanying the source activity (solar radio emissions, radio bursts, soft X-rays, and hard X-ray bursts – when possible – in different energy ranges).
2. Instrumentation and data description
2.1. Low energy telescope (LET)
For our study we use low energy proton data within the energy range 6–10 MeV recorded by the Low Energy Telescope (LET) (Mewaldt et al. 2008), a part of the In-situ Measurements for Particles and CME Transients (IMPACT) suite (Luhman et al. 2008), flying on board both STEREO spacecraft. The LET measures low energy protons from 1.8 MeV to 10 MeV, He in the range of 4–10 MeV/nuc, and heavier ions at several energies. The detectors of the LET instrument comprise two fans with viewing directions each spanning 133° of longitude in the ecliptic and ±15–20° of latitude out of the ecliptic (Mewaldt et al. 2008), providing accurate directional information and sectored rates covering 16 different viewing directions, accumulated with a one-minute cadence raising from 1.8–12 Mev/nuc, depending on the species (Leske et al. 2013). Details about the LET data can be found in Mewaldt et al. (2008) and in the online repositories3.
2.2. Solar electron proton telescope (SEPT)
We have also used near relativistic electron recordings at 55–85 keV from the Solar Electron Proton Telescope (SEPT) (Müller-Mellin et al. 2008) which also belongs to the IMPACT suite of the STEREO spacecraft. The SEPT instrument consists of two dual, double-ended magnet/foil solid state detector particle telescopes that separate and measure electrons in the energy range 20–400 keV and protons from 60–7000 keV, while providing anisotropy information through the use of several fields of view, in particular 52° and 52.8° view cones in four directions. Two SEPT units (NS: north-south direction, E: ecliptic) are located on each STEREO spacecraft: SEPT-E looking in the ecliptic plane along the nominal direction of the IMF 45° west with respect to the spacecraft-Sun line both towards and away from the Sun, and SEPT-NS looking vertical to the ecliptic plane towards north and south. The maximum temporal resolution of the data is 1 min and the nominal geometric factor is 5.1 cm2 sr. Details about the SEPT data can be found in Müller-Mellin et al. (2008) and in the online repositories4.
3. Compilation of the STEREO catalogues
3.1. SEP event selection
3.1.1. Selection
First we made a survey of the 10 min averaged low energy proton intensities within the energy range 6–10 MeV from the LET instrument from 2007 to 2012. We spotted all enhancements above the quiet-time background level of LET which was determined as ≈2 × 10⁻⁵ cm-2 sr-1 s-1 MeV-1. That means that all of the intensities that were above the aforementioned threshold were listed as possible candidates of SEP events. We applied no other intensity threshold restriction (e.g., the criterion of the intensity exceeding at least one order of magnitude above the background intensity during the SEP event) so that we could make sure that even the smallest SEP events would be identified and included in these catalogues. Furthermore, in case of successive enhancements we manually determined the start and end time of each event and their characteristics were calculated separately. The meticulous scanning and this careful hand-picked procedure for the identification of the possible SEP events led to the inclusion of all candidate SEP events while excluding none. In Fig. 1 we present an illustration of the methodology that we applied for the survey of the LET data that led to the identification of the possible candidates for the SEP events. One-day averaged intensities (in cm-2 sr-1 s-1 MeV-1) of 6–10 MeV protons recorded at LET as a function of time from 2007 to the end of 2012 are presented in both panels. We have chosen to show one-day averaged data in order to demonstrate the time length of the whole survey (i.e., 2007 to 2012) in one figure. The quiet-time background level is presented in both panels with a straight line, red in the case of STA (bottom panel) and blue in the case of STB (upper panel).
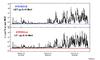 |
Fig. 1 LET proton intensity at the STA and STB spacecraft from 2007 to the end of 2012 (daily averaged), as a function of time. Top panel presents the scanning in LET 6–10 MeV protons recorded by STB, while the bottom panel presents the same survey at STA measurements. See text for details. This figure was created at SEPServer http://server.sepserver.eu. |
3.1.2. Solar origin of the events
Given the fact that STEREO was launched at the end of 2006 and that the declining phase of solar cycle 23 was extended up to 2008, within at least the first year of the survey we had performed (that is from 2007 to 2008), a significant number of enhancements could have been related to corotating interaction regions (CIRs) and/or stream interaction regions (SIRs; Gómez-Herrero et al. 2011a). In order to explore this possibility, we turned at first to the available literature. At the time of our study and since the STEREO spacecraft first operated within the extended minimum of solar cycle 23, a number of published works were targeted for the identification of CIRs recorded by a combination of the available spacecraft armada operating at 1 AU (Leske et al. 2008, 2009; Mason et al. 2009; Gómez-Herrero et al. 2011a). Furthermore, single case studies, such as the 18 August 2010 event (Gómez-Herrero et al. 2011b; Leske et al. 2011) and the May 2007 SEP events (Bucík et al. 2009), allowed us to apply a first round of clearing up to the initial sample of enhancements. The results of this literature survey were used as a first estimate for the presence or absence of a CIR enhancement in our tabulated candidate sample of enhancements.
Furthermore, the Space Physics Center at the University of California (UCLA) maintains
catalogues of SIRs identified by STEREO recordings5. Hence, we have also cross correlated our initial sample of enhancements to
the identified intervals that SIRs were observed at both STEREO spacecraft. This check
was applied to the whole sample of the possible SEP event candidates, that is from 2007
to 2012. An example of the CIR effect that was recorded at the lowest energy LET proton
channel (1.8–3.6 MeV) at both STEREO spacecraft in August 2008 is presented in Fig.
2. The yellow lines indicate the boundaries of
the CIR at each respective spacecraft. The CIR pattern and the corresponding delay are
clearly illustrated: STB enters the CIR and while the CIR follows the corotation
pattern, a few days later STA also encounters it. In this time period, the separation
angle between STA and STB was ≈65° and therefore the CIR needed almost 4.5 days in order
to cover the distance between both spacecraft. This is consistent with the expected
corotation time between two points located at heliolongitudes ΦA and ΦB with heliocentric distances
rA and rB. It can be
estimated by  (1)where
Ω is the sidereal angular
velocity of the Sun, and uSW is the solar wind speed (assumed
to be radial). The effect of the differential solar rotation can be neglected and
Ω is assumed to be
independent of the heliographic latitude (for details see Gómez-Herrero et al. 2011a).
(1)where
Ω is the sidereal angular
velocity of the Sun, and uSW is the solar wind speed (assumed
to be radial). The effect of the differential solar rotation can be neglected and
Ω is assumed to be
independent of the heliographic latitude (for details see Gómez-Herrero et al. 2011a).
Moreover, we made cross correlations to available lists of shocks6 in order to spot if the recorded enhancements, which were tabulated in our catalogues as possible SEP events, were shock related enhancements. This was also an important step towards the compilation of the catalogues since this kind of enhancements may be dominant during the decay phase of SEP events, especially when multiple events take place in sequence (Desai et al. 2003). In addition, we made use of STEREO solar wind data from the Plasma and Suprathermal Ion Composition (PLASTIC; Galvin et al. 2008) to identify possible interplanetary (IP) shocks that had been missed by the aforementioned list and energetic storm particle (ESP) events.
With the aim of identifying the solar origin of the candidate enhancements that we had initially identified, we made a parallel scanning of high time resolution 1 min, 5 min, and 10 min near relativistic electron recordings from SEPT within the energy range of 55–85 keV. Our goal was to identify which of the candidate enhancements that we had tabulated as possible SEP events also presented an electron signature in SEPT, because the ratio of protons-to-electrons varies in CIRs with electron events being rare and proton events relatively common (Richardson 2004). Figures 3 and 4 present the parallel scanning of protons and electrons at STA and STB. Figure 3 refers to STA. The top panel presents the one-day averaged intensities (in cm-2 sr-1 s-1 MeV-1) of SEPT electrons within the energy range 65–75 keV, whereas the bottom panel presents the one–day averaged intensities (in cm-2 sr-1 s-1 MeV-1) of LET protons 6–10 MeV, as a function of time from 2007 to the end of 2012. The red line in the bottom panel underlines the quiet time background of LET. Figure 4 is similar to Fig. 3 but for STB measurements.
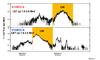 |
Fig. 2 A CIR associated particle increase recorded by both STA and STB. The yellow lines and the corresponding shaded areas demonstrate the extent of the CIR at both spacecraft. See text for details. |
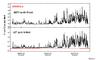 |
Fig. 3 LET and SEPT measurements of the STA spacecraft from 2007 to the end of 2012 (daily averaged). Top panel presents the scanning in SEPT data in the 65–75 keV electrons, while the bottom panel presents the relevant survey of the LET 6–10 MeV protons. See text for details. This figure was created at SEPServer http://server.sepserver.eu |
 |
Fig. 4 Same notion as in Fig. 3. STB measurements. |
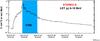 |
Fig. 5 An illustration of the effect of an ICME on the SEP profile of the 2012 July 23 event. The shaded blue area indicates the ICME boundaries. See text for details. |
In addition, we also scanned the recordings of high energy protons observed by the High Energy Telescope (HET) from 40 MeV to 100 MeV (von Rosenvinge et al. 2008) in order to identify which of the events in our catalogues extend to high energies and thus in terms of space weather effects which are the most relevant ones (Vainio et al. 2013).
Another cross correlation to the available lists of ICMEs was applied7 with the aim of identifying the IP conditions within which the SEP events evolved. An example of a rather irregular ICME and its corresponding effect on the time profile of the SEP event of 2012 July 23 recorded by LET protons from 6–10 MeV on board STA is presented in Fig. 5. We illustrate the intensity of the LET protons (in cm-2 sr-1 s-1 MeV-1) as a function of time. This is event 107 of our STA catalogue (see Table 1). The blue shaded area defines the boundaries of the ICME reported both in the UCLA catalogue (see the relevant URL above) and in Russell et al. (2013). We should also note that in the preparatory phase of the compilation of the STEREO catalogues we considered the automated SEP event identification system based on LET recordings8; however, we tend to believe that because of its automatic procedure, several events were either missed or mislabeled as events.
3.2. Time-shifting analysis
For the first arriving particles it is possible to perform TSA (Malandraki et al. 2012; Vainio et al.
2013). SEPT records electrons within the energy range of 20–400 keV (see Sect.
2.2). In our analysis we used electrons ranging
from 55–85 keV. The corresponding mean velocity for such near relativistic electrons would
be 0.47c. The
length of the Parker spiral L can be computed based on the solar wind speed
uSW during the event as follows (Vainio et al. 2013; Papaioannou et al. 2014): we assume that the spiral length, L, traveled by the
particles is the spiral from the center of the Sun to the spacecraft location
(R ≈ 1 AU)
minus the spiral from the center of the Sun to its edge (i.e., the distance equal to 1
solar radius  )
according to
)
according to 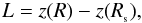 (2)where
![Mathematical equation: \begin{eqnarray} z(r)=\frac{a}{2} \left[\rm{ln} \left(\frac{r}{a} + \sqrt{1+r^2{/}a^2}\right)+\frac{r}{a}\sqrt{1+r^2{/}a^2}\right] \end{eqnarray}](/articles/aa/full_html/2014/09/aa23336-13/aa23336-13-eq27.png) (3)and
α =
uSW/Ω, given that Ω corresponds to the equatorial sidereal
rotation period (i.e., 2π/Ω =
24.47d). We used the uSW measured by the STEREO/PLASTIC
instrument Galvin et al. (2008) for each event in
our lists9.
(3)and
α =
uSW/Ω, given that Ω corresponds to the equatorial sidereal
rotation period (i.e., 2π/Ω =
24.47d). We used the uSW measured by the STEREO/PLASTIC
instrument Galvin et al. (2008) for each event in
our lists9.
For the first arriving particles we assume scatter-free propagation and we calculate the
expected release time of the near relativistic electrons, trelease, adding
8.33 min for comparison with EM observations (e.g., radio burst), as
 (4)Preforming
TSA provides an estimate of the latest possible release time of relativistic electrons
from the Sun that is consistent with the determined onset time at each STEREO spacecraft.
Therefore, it should be noted that TSA is a rough approximation and only provides a first
insight on the propagation of the particles within the limitations of the assumption made.
(4)Preforming
TSA provides an estimate of the latest possible release time of relativistic electrons
from the Sun that is consistent with the determined onset time at each STEREO spacecraft.
Therefore, it should be noted that TSA is a rough approximation and only provides a first
insight on the propagation of the particles within the limitations of the assumption made.
3.3. Solar associations
Given the SRT that has been calculated using Eq. (4), an attempt has been made to identify the associated solar events using SXR, HXR, and radio data. It is expected that the EM emissions related to SEPs detected at the spacecraft occur in the early phase of the solar event, when the high-energy particles are accelerated close to the Sun. In general, a time interval of several hours near the SRT inferred from the SEP measurements, especially energetic electrons, has been examined in the search for relevant EM data. Type III bursts at decameter wavelengths (frequencies <30 MHz) are a typical radio counterpart of SEP events; Cane et al. (2010). Relevant observations are provided by the WAVES spectrograph aboard STEREO (Bougeret et al. 2008). The identification of a SXR burst may give another indication of the time interval where potentially relevant EM emission might occur in association with a given SEP event, but since there is no SXR monitor aboard the STEREO spacecraft, this criterion may fail simply because the emission, which comes from the low corona, may be occulted when observed by Earth-orbiting spacecraft (e.g., GOES satellites).
The time intervals of relevant EM observations were chosen for each SEP event and each instrument by visual inspection of quick look plots, starting with the STEREO/WAVES plots10, including some time for background identification before the event onset. There is some subjectivity in the delimitation of an interesting interval.
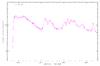 |
Fig. 6 Corrected RHESSI count rate light curve of the 2011 August 10 solar flare for the 6–12 keV (in pink) energy channel. Generated with the RHESSI software. |
For the identification of the associated solar event in SXR and HXR the Ramaty High Energy Solar Spectrographic Imager (RHESSI) spacecraft (Lin et al. 2002) was used. It is a solar-dedicated X-ray and gamma-ray observatory, which consists of an imager made of nine rotating modulation collimators (nine pairs of grids) in front of a spectrometer with nine cooled germanium detectors. The energy range for observations is 3 keV to 17 MeV. RHESSI provides light curves, spectra, and images with an angular resolution depending on the energy (down to 2.3′′ at 100 keV). RHESSI data for long duration solar events, such as the ones usually associated with SEP events, are complex both because of the observational technique (in particular the modulation of the signal by the pairs of grids as the spacecraft rotates so as to build images) and to the orbit (interruptions of solar observations due to eclipses and passages through the SAA for certain orbits). The count rate modulations due to the spacecraft spinning and the modification of the count rates due to the change of the attenuator states (to reduce pulse pile up in the case of large counting rates) are corrected using standard RHESSI procedures (corrected count rates from the observing summary files). Time intervals where the spacecraft was in the Earth’s shadow or in the South Atlantic Anomaly have been removed from the data. For each SEP event registered either at STA and/or STB, a corrected count rate light curve is delivered, with 4 s time resolution. Figure 6 shows, as an example, the light curve of the parent solar activity on 2011 August 10 that could be associated with the SEP event registered at STA on the same day. We note that time periods of night, passage through SAA, and change of attenuators are not included on the plot.
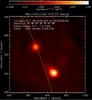 |
Fig. 7 RHESSI image of the 2011 August 10 solar flare in the energy range 6–12 keV. |
Moreover, images for selected times and selected energy bands are provided for most events. The selection of images is defined based on a preliminary scientific analysis of each event. Figure 7 shows an image of the 2011 August 10 solar flare, integrated over a 5 min period for the 6–12 keV energy range. Detectors 3–9 were used and the image was processed by means of the Clean algorithm (see more details about the imaging technique and algorithms in Hurford et al. 2002). The yellow line marks the limb of the Sun.
It must be noted that this solar flare was registered by STA but not by STB because the parent source was located in the western solar hemisphere as viewed from the Earth, with STA looking at that hemisphere, whereas STB was connected to the eastern solar hemisphere, as can be seen in Fig. 8. This figure shows the position of each STEREO (STA in red and STB in blue) at the moment of the solar flare with respect to the Earth’s position (in green). This kind of information (position of the spacecraft as well as position of the solar source) is also included in the catalogue for each SEP event so the user can quickly assess the scenario.
4. Multispacecraft events
In the canonical two-class SEP event paradigm, particles accelerated during impulsive-flare associated SEP events are characterized by a small spatial scale of the source and thus typically lead to a modest angular spread of energetic particles. On the contrary, the broadest angular spreads observed in large SEP events are commonly interpreted in terms of extended acceleration in a CME shock that intercepts IMF lines connecting to the observer (Heras et al. 1995; Rouillard et al. 2011). In the absence of CME-driven shocks, the longitudinal spread of the particles has been attributed either to the lateral transport in the corona or in the IP medium (Dresing et al. 2012). Therefore, multi-spacecraft observations of SEP events within the STEREO era, enables further investigations of these cases and allows more general conclusions to be reached based on a statistical treatment of these events. To this end, comprehensive and up-to-date catalogues of SEP events greatly facilitate such studies.
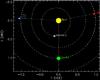 |
Fig. 8 Location of the two spacecraft at the moment of the parent activity. |
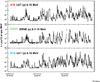 |
Fig. 9 Averaged proton intensities at STA (top panel), SOHO (middle panel), and STB (bottom panel) as a function of time from 2010 to 2012. See text for details. |
After the extended solar minimum of solar cycle 23, a significant increase in SEP activity starting late in 2009 was observed. From 2009 to 2012, several events were detected simultaneously by both LET telescopes on board the two STEREO spacecraft when their longitudinal separation ranged from ≈88° to >268°. A subset of these events also presented a clear signature at SOHO. In Fig. 9 we present the one–day averaged intensities of STA LET protons from 6–10 MeV (top panel), SOHO/ERNE protons from 8.1–10 MeV (middle panel), and STB LET protons from 6–10 MeV (bottom panel) in cm-2 sr-1 s-1 MeV-1 as a function of time, from 2010 to 2012. As an indicative example and with the intention to illustrate the simultaneous detection of an event in several observation points within the heliosphere, in Fig. 10 we present the series of multispacecraft events that were recorded from both electrons (bottom panel) at ACE/EPAM 45–62 keV (black line), STA/SEPT 55–65 keV (red line), and STB/SEPT 55–65 keV (blue line) and from protons (top panel) at SOHO/ERNE 8.1–10 MeV (black line), STA/LET 6–10 MeV (red line), and STB LET 6–10 MeV (blue line) from 2012 March 04–14. The SEP time profiles are organized with respect to the longitude of the observer (Cane et al. 1988). The spacecraft that is connected to the west part of the solar source at every time exhibits a faster rise compared to the other two. For example STB is well connected at the beginning of the 2012 March period.
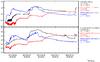 |
Fig. 10 The series of multispacecraft SEP events of 2012 March 04–14. Top panel illustrates protons from STA/LET, SOHO/ERNE, and STB/LET whereas the bottom panel refers to electron recordings from STA/SEPT, ACE/EPAM, and STB/SEPT. See text for details. This figure was created at SEPServer http://server.sepserver.eu. |
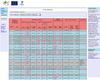 |
Fig. 11 A snapshot of the actual online layout of the SEPServer STEREO catalogues. |
In this section, we present a survey of multispacecraft observations SEP events that constitutes a subset of the SEPServer STEREO catalogues. This subset of SEP events presented clear recordings at both STEREO spacecraft, i.e., STA and STB at LET protons 6–10 MeV and SEPT electrons 55–85 keV measurements. With the aim of facilitating further exploitation of the SEPServer STEREO catalogues we tabulate the multipoint in-situ observations at 1 AU utilizing the already reported associations to the relevant solar phenomena from Bucík et al. (2009); Lario et al. (2013) and Dresing et al. (2013). All of this information is summarized in Table 5.
Solar energetic particle events recorded onboard STA from 2007–2012.
Solar energetic particle events recorded onboard STB from 2007–2012.
STA solar associated observations.
STB Solar associated observations.
5. Summary of results
Using the methodology that has been furnished in Sect. 3.1, we have identified a total of 130 SEP events for STA (see Table 1) and 108 SEP events for STB (see Table 2). It is noteworthy that the number of events per year for each spacecraft doubled in 2012 when the solar cycle 24 seems to have its actual peak.
In Table 1 we present the SEP events that were recorded at STA. Column 1 gives the number of the event with the first one starting at 0, Cols. 2, and 3, the onset and peak time of the SEP event at LET 6–10 MeV protons, Col. 4 presents the peak value of the SEP event at LET 6–10 MeV protons (in cm-2 sr-1 s-1 MeV-1), Cols. 5–7 provide the same quantities for SEPT 55–85 keV electrons. The same notation applies to Table 2 for the events recorded by STB. Furthermore, those events that are interpreted as multispacecraft ones, that is events that have been recorded on both LET instruments at STA and STB are summarized in Table 5.
Table 5 presents the date of the event in Col. 2, the related active region (AR) of the parent solar flare as well as the flare site in Cols. 3 and 4, the Type III burst identified in the quick look plots of Wind/WAVES in Col. 5, SWAVESA in Col. 6 and SWAVESB in Col. 7. In Col. 8 the time intervals of Type II bursts observed by one or several of the spectrographs are listed. The onset time was read from the quick look plots, the end times are mostly from the listing provided by http://ssed.gsfc.nasa.gov/waves/data_products.html. Finally, Col. 9 presents the relevant CME as it was observed by STEREO coronographs11. Information on the associated flares is mostly quoted from literature, especially from the papers by Bucík et al. (2009); Lario et al. (2013) and Dresing et al. (2013). The relevant CMEs have been identified by the SEPServer consortium.
Multispacecraft Sep. events reported in SEPServer STEREO catalogues and related solar data.
Table 3 presents the relevant solar associations for the SEP events of STA: the event number (Col. 1), starting with 0 in accordance with Table 1, the start and end time where an associated solar radio emission has been searched for (Cols. 2 and 3), and the onset time and type of the decametric radio burst, Type III or Type II, as identified in the STA/WAVES quick look plots. In some events the “o” within parentheses indicates that the high-frequency part of this radio emission was occulted, suggesting that the parent active region was behind the limb as seen by STA. Colums 5 and 6 list the time interval where RHESSI data have been inspected for X-ray emission. Column 7 gives the coordinates of the main X-ray source projected onto the solar disk, measured in arc seconds with respect to the disk center as viewed from Earth. It should be noted that the identification of the possible apparent solar source includes several ambiguities and thus this information should be treated as an indication for the user of the SEPServer STEREO catalogues and not as a final identification of the source. Similar notation applies to Table 4, which presents the relevant solar associations for the SEP events of STB.
Since the first scanning and the backbone of this survey was low energy protons (LET: 6–10 MeV protons), the parallel scanning of NR electrons (SEPT: 55–85 keV) gave rise to another result: almost 85% of the events in our catalogues also present an electron signature. Furthermore, a smaller group of events that constitutes 30% of our total sample of 238 events present signatures in HET energies (40–100 MeV) and thus can be considered as the most space weather relevant events in the sample. Finally, the majority of the events from 2007 to 2011 present a related Type III radio burst (see Tables 3 and 4 for reference).
6. Online access to the catalogues
The STEREO catalogues are one of the major results of the SEPServer project (Vainio et al. 2013)12. The user of SEPServer has direct access to the information presented in Tables 1–4 in both textual and graphical form. Furthermore, both catalogues provide the user with onset, peak time, and peak value of the proton and the electron event together with complementary figures, position plots denoting the separation of STEREO spacecraft with respect to the Sun-Earth line, spectrograms of EM emissions from all available data sets provided by SEPServer, HXR images, and figures of the apparent solar source (when available) from RHESSI. For all the events the user is able to retrieve the results of TSA in text form as well as for the multispacecraft events comparative figures of the event in both spacecraft.
SEPServer aims at facilitating easy access through the catalogues to the underlying database of SEP data and related EM observations. To this end a novel feature that allows the user to have a direct link to the central SEPServer database for further exploitation and scientific analysis per event has been implemented. This direct link is accessed through the event number in the first column of the catalogue, and it leads the user to the central SEPServer database where the epoch range has been set according to the start and end times that define that specific SEP event. From this point on, the user can choose to make plots (including multipanel plots) based on the available SEPServer datasets and thus investigate further this specific SEP event.
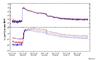 |
Fig. 12 SEP event of 2011 November 03. Time profile of the SEP event intensity (in cm-2 sr-1 s-1 MeV-1), from 2011 November 03–10. Top panel: SEPT electron recordings in three energy ranges (55–65 keV/black line, 65–75 keV/blue line, and 75–85 keV/red line). Bottom panel: LET proton measurements ranging from 1.8 MeV to 10 MeV in two energy ranges (1.8–3.6 MeV/black line, 4.0–6.0 MeV/red line, 6.0–10 MeV/blue line). This figure was created at SEPServer http://server.sepserver.eu |
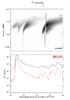 |
Fig. 13 Solar associated data (wind/waves spectrogram denoting a Type III burst according to the calculated SRT and complementary SXRs from GOES) for the event of 2011 November 03. |
In Fig. 12 we present an example of the items that would be made available through the STEREO catalogues at SEPServer portal. In the top panel we demonstrate the recordings of the SEP event of 2011 November 03 at LET measurements from 1.8 MeV to 10 MeV and in the bottom panel the corresponding recordings from SEPT electrons within the energy range 55–105 keV. Moreover, in Fig. 13 we present the associated solar events. A clear correspondence of the estimated SRT with a Type III radio burst observed by the WAVES experiment aboard WIND is identified. The user of the online catalogues may be led to the following conclusion with respect to the event of 2011 November 03: the SEP event is not related to the SXR burst shown in the bottom panel on the left part of Fig. 13 at the beginning of the plot. The fact that there is no conspicuous SXR burst with the inferred electron release and the Type III burst seen by Wind/WAVES suggests the parent event is behind the Sun as seen from the Earth, but not too far, because the Type III bursts are clearly visible. This corresponds to the first level of information that the user of SEPServer will have access to.
7. Conclusions
We have performed a systematic scanning of STEREO LET recordings within the energy range 6–10 MeV from 2007 to 2012. A total of 130 SEP events were identified in the measurements of STA and 108 in STB, leading to comprehensive catalogues of SEP events.
We performed TSA for near relativistic electrons (55–85 keV) in order to infer the release time of electrons and to identify the relevant Type III radio burst which denotes the escape of particles into the IP space. Based on parallel scanning of ARTEMIS, NDA, Wind/WAVES, and SWAVES data on STA and STB we have tabulated the associated solar events in Tables 3 and 4. Furthermore, in the same tables we present associations with SXRs and HXR count-rates as well as RHESSI HXR images showing the apparent solar source (when available).
Moreover, the identified multispacecraft events included in the SEPServer STEREO catalogues are presented at Table 5. This includes the identification of the parent solar event as this was reported already in the literature together with the relevant information derived by the STEREO CME catalogue and the identified SWAVES type II bursts.
The results of our analysis can be freely utilized in future studies. In addition to the tabulated information presented in this paper, our website13 offers access to a variety of information related to the events. One should also note that through the catalogues the user of SEPServer has direct access to the underlying database in order to facilitate further exploitation of our results. The extension of the SEPServer STEREO catalogues is a natural continuation of the current work and updates will be posted at the online repository in due time.
E.g., http://www.swpc.noaa.gov/ and http://server.sepserver.eu
Again from UCLA at http://www-ssc.igpp.ucla.edu/~jlan/STEREO/Level3/STEREO_Level3_Shock.pdf
Again from UCLA at http://www-ssc.igpp.ucla.edu/~jlan/STEREO/Level3/STEREO_Level3_ICMEs.pdf
Provided by http://secchirh.obspm.fr/index.php
Available at http://cor1.gsfc.nasa.gov/catalog/
Available at http://server.sepserver.eu
Acknowledgments
The research leading to these results has received funding from the European Union’s Seventh Framework Programme (FP7/2007-2013) under Grant Agreement No. 262773 (SEPServer). R.G.H. acknowledges the financial support of the Spanish MINECO under project AYA2012-39810-C02-01.
References
- Bougeret, J. L., Goetz, K., Kaiser, M. L., et al. 2008, Space Sci. Rev., 136, 487 [NASA ADS] [CrossRef] [Google Scholar]
- Bučík, R., Mall, U., Gómez-Herrero, R., et al. 2009, Sol. Phys., 256, 361 [NASA ADS] [CrossRef] [Google Scholar]
- Cane, H., Reames, D. V., & von Rosenvinge, T. T. 1988, J. Geophys. Res., 93, 9555 [NASA ADS] [CrossRef] [Google Scholar]
- Cane, H., Richardson, I. G., & von Rosenvinge, T. T. 2010, J. Geophys. Res., 115, 08101 [NASA ADS] [Google Scholar]
- Desai, M. I., Mason, G. M., Dwyer, J. R., et al. 2003, ApJ, 588, 1149 [NASA ADS] [CrossRef] [Google Scholar]
- Dresing, N., Gómez-Herrero, R., Heber, B., et al. 2009, Sol. Phys., 256, 409 [NASA ADS] [CrossRef] [Google Scholar]
- Dresing, N., Gómez-Herrero, R., Klassen, A., et al. 2012, Sol. Phys., 281, 281 [NASA ADS] [Google Scholar]
- Dresing, N., Gómez-Herrero, R., Klassen, A., et al. 2013, in Proc. 33rd Int. Cosmic Ray Conf., Rio de Janeiro, Brazil, No. 0611 [Google Scholar]
- Galvin, A. B., Kistler, L. M., Popecki, M. A., et al. 2008, Space Sci. Rev., 136, 437 [NASA ADS] [CrossRef] [Google Scholar]
- Gómez-Herrero, R., Malandraki, O. E., Dresing, N., et al. 2011a, JASTP, 73, 551 [NASA ADS] [Google Scholar]
- Gómez-Herrero, R., Kartavykh, Y., Dröge, W., et al. 2011b, in Proc. 32nd Int. Cosmic Ray Conf., Beijing, China, 10, 204 [Google Scholar]
- Heber, B., Agueda, N., Heynderickx, D., et al. 2013, in Proc. 33rd Int. Cosmic Ray Conf., Rio de Janeiro, Brazil, No. 0761 [Google Scholar]
- Heras, A. M., Sanahuja, B., Lario, D., et al. 1995, ApJ, 445, 497 [NASA ADS] [CrossRef] [Google Scholar]
- Hurford, G. J., Schmahl, E. J., Schwartz, R. A., et al. 2002, Sol. Phys., 210, 61 [NASA ADS] [CrossRef] [Google Scholar]
- Kaiser, M. L., Kucera, T. A., Davila, J. M., et al. 2008, Space Sci. Rev., 136, 5 [NASA ADS] [CrossRef] [Google Scholar]
- Lario, D., Aran, A., Gómez-Herrero, R., et al. 2013, ApJ, 767, 41 [NASA ADS] [CrossRef] [Google Scholar]
- Laurenza, M., Cliver, E. W., Hewitt, J., et al. 2009, Space Weather, 7, S04008 [NASA ADS] [CrossRef] [Google Scholar]
- Leske, R. A., Mewaldt, R. A., Mason, G. M., et al. 2008, in Particle Acceleration and Transport in the Heliosphere and Beyond – 7th Annual Astrophysics Conference, eds. G. Li, Q. Hu, O. Verkhoglyadova, G. P. Zank, R. P. Lin, & J. Luhmann, AIP Conf. Proc., 1, 131 [Google Scholar]
- Leske, R. A., Mason, G. M., Mewaldt, R. A., et al. 2009, in Proc. 31st Int. Cosmic Ray Conf., Lodz, Slovakia, No. 0537 [Google Scholar]
- Leske, R. A., Mewaldt, R. A., Mason, G. M., et al. 2010, in AIP Conf. Proc., 12th International Solar Wind Conference, 1216, 379 [Google Scholar]
- Leske, R. A., Cohen, C. M. S., Mewaldt, R. A., et al. 2011, in Proc. 32nd Int. Cosmic Ray Conf., Beijing, China, 10, 200 [Google Scholar]
- Leske, R. A., Cohen, C. M. S., Mewaldt, R. A., et al. 2012, Sol. Phys., 281, 301 [NASA ADS] [CrossRef] [Google Scholar]
- Leske, R. A., Cohen, C. M. S., Mewaldt, R. A., et al. 2013, in Proc. 33rd Int. Cosmic Ray Conf., Rio de Janeiro, Brazil, No. 0583 [Google Scholar]
- Lin, R. P., Dennis, B. R., Hurford, G. J., et al. 2002, Sol. Phys., 210, 3 [Google Scholar]
- Luhmann, J. G., Curtis, D. W., Schroeder, P., et al. 2008, Space Sci. Rev., 136, 117 [NASA ADS] [CrossRef] [Google Scholar]
- Malandraki, O. E., Agueda, N., Papaioannou, A., et al. 2012, Sol. Phys., 281, 333 [NASA ADS] [Google Scholar]
- Malandraki, O. E., Papaioannou, A., Agueda, N., et al. 2013, Proc. 11th Hellenic Astronomical Conference, Athens, Greece, http://www.helas.gr/conf/2013/ [Google Scholar]
- Mason, G. M., Desai, M. I., Mall, U., et al. 2012, Sol. Phys., 256, 393 [Google Scholar]
- Mewaldt, R. A., Cohen, C. M. S., Cook, W. R., et al. 2008, Space Sci. Rev., 136, 285 [NASA ADS] [CrossRef] [Google Scholar]
- Mewaldt, R. A., Russell, C. T., Cohen, C. M. S., et al. 2013, in Proc. 33rd Int. Cosmic Ray Conf., Rio de Janeiro, Brazil, No. 1186 [Google Scholar]
- Müller-Mellin, R., Böttcher, S., Falenski, J., et al. 2008, Space Sci. Rev., 136, 363 [NASA ADS] [CrossRef] [Google Scholar]
- Papaioannou, A., Malandraki, O. E., Heber, B., et al. 2013, Proc. 11th Hellenic Astronomical Conference, Athens, Greece, http://www.helas.gr/conf/2013/ [Google Scholar]
- Papaioannou, A., Souvatzoglou, G., Paschalis, P., et al. 2014, Sol. Phys., 289, 423 [Google Scholar]
- Reames, D. V. 2013, Space Sci. Rev., 175, 53 [NASA ADS] [CrossRef] [Google Scholar]
- Richardson, I. G. 2004, Space Sci. Rev., 111, 267 [NASA ADS] [CrossRef] [Google Scholar]
- Rouillard, A. P., Odstrcil, D., Sheeley, N. R., et al. 2011, ApJ, 735, 7 [Google Scholar]
- Russell, C. T., Mewaldt, R. A., Luhmann, J. G., et al. 2013, ApJ, 770, 38 [Google Scholar]
- Tan, L., Malandraki, O. E., Reames, D. V., et al. 2013, ApJ, 768, 68 [NASA ADS] [CrossRef] [Google Scholar]
- Vainio, R., Desorgher, L., Heynderickx, D., et al. 2009, Space Sci. Rev., 147, 187 [Google Scholar]
- Vainio, R., Valtonen, E., Heber, B., et al. 2013, J. Space Weather Space Climate, 3, A12 [Google Scholar]
- von Rosenvinge, T. T., Reames, D. V., Baker, R., et al. 2008, Space Sci. Rev., 136, 391 [NASA ADS] [CrossRef] [Google Scholar]
- Wiedenbeck, M. E., Mason, G. M., Cohen, C. M. S., et al. 2013, ApJ, 762, 54 [NASA ADS] [CrossRef] [Google Scholar]
All Tables
Multispacecraft Sep. events reported in SEPServer STEREO catalogues and related solar data.
All Figures
|
Fig. 1 LET proton intensity at the STA and STB spacecraft from 2007 to the end of 2012 (daily averaged), as a function of time. Top panel presents the scanning in LET 6–10 MeV protons recorded by STB, while the bottom panel presents the same survey at STA measurements. See text for details. This figure was created at SEPServer http://server.sepserver.eu. |
| In the text | |
|
Fig. 2 A CIR associated particle increase recorded by both STA and STB. The yellow lines and the corresponding shaded areas demonstrate the extent of the CIR at both spacecraft. See text for details. |
| In the text | |
|
Fig. 3 LET and SEPT measurements of the STA spacecraft from 2007 to the end of 2012 (daily averaged). Top panel presents the scanning in SEPT data in the 65–75 keV electrons, while the bottom panel presents the relevant survey of the LET 6–10 MeV protons. See text for details. This figure was created at SEPServer http://server.sepserver.eu |
| In the text | |
|
Fig. 4 Same notion as in Fig. 3. STB measurements. |
| In the text | |
|
Fig. 5 An illustration of the effect of an ICME on the SEP profile of the 2012 July 23 event. The shaded blue area indicates the ICME boundaries. See text for details. |
| In the text | |
|
Fig. 6 Corrected RHESSI count rate light curve of the 2011 August 10 solar flare for the 6–12 keV (in pink) energy channel. Generated with the RHESSI software. |
| In the text | |
|
Fig. 7 RHESSI image of the 2011 August 10 solar flare in the energy range 6–12 keV. |
| In the text | |
|
Fig. 8 Location of the two spacecraft at the moment of the parent activity. |
| In the text | |
|
Fig. 9 Averaged proton intensities at STA (top panel), SOHO (middle panel), and STB (bottom panel) as a function of time from 2010 to 2012. See text for details. |
| In the text | |
|
Fig. 10 The series of multispacecraft SEP events of 2012 March 04–14. Top panel illustrates protons from STA/LET, SOHO/ERNE, and STB/LET whereas the bottom panel refers to electron recordings from STA/SEPT, ACE/EPAM, and STB/SEPT. See text for details. This figure was created at SEPServer http://server.sepserver.eu. |
| In the text | |
|
Fig. 11 A snapshot of the actual online layout of the SEPServer STEREO catalogues. |
| In the text | |
|
Fig. 12 SEP event of 2011 November 03. Time profile of the SEP event intensity (in cm-2 sr-1 s-1 MeV-1), from 2011 November 03–10. Top panel: SEPT electron recordings in three energy ranges (55–65 keV/black line, 65–75 keV/blue line, and 75–85 keV/red line). Bottom panel: LET proton measurements ranging from 1.8 MeV to 10 MeV in two energy ranges (1.8–3.6 MeV/black line, 4.0–6.0 MeV/red line, 6.0–10 MeV/blue line). This figure was created at SEPServer http://server.sepserver.eu |
| In the text | |
|
Fig. 13 Solar associated data (wind/waves spectrogram denoting a Type III burst according to the calculated SRT and complementary SXRs from GOES) for the event of 2011 November 03. |
| In the text | |
Current usage metrics show cumulative count of Article Views (full-text article views including HTML views, PDF and ePub downloads, according to the available data) and Abstracts Views on Vision4Press platform.
Data correspond to usage on the plateform after 2015. The current usage metrics is available 48-96 hours after online publication and is updated daily on week days.
Initial download of the metrics may take a while.