Fig. 12
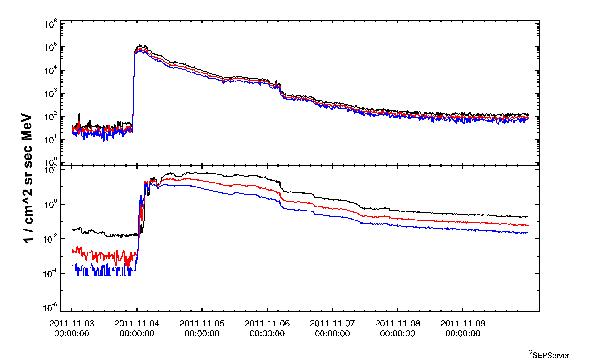
SEP event of 2011 November 03. Time profile of the SEP event intensity (in cm-2 sr-1 s-1 MeV-1), from 2011 November 03–10. Top panel: SEPT electron recordings in three energy ranges (55–65 keV/black line, 65–75 keV/blue line, and 75–85 keV/red line). Bottom panel: LET proton measurements ranging from 1.8 MeV to 10 MeV in two energy ranges (1.8–3.6 MeV/black line, 4.0–6.0 MeV/red line, 6.0–10 MeV/blue line). This figure was created at SEPServer http://server.sepserver.eu
Current usage metrics show cumulative count of Article Views (full-text article views including HTML views, PDF and ePub downloads, according to the available data) and Abstracts Views on Vision4Press platform.
Data correspond to usage on the plateform after 2015. The current usage metrics is available 48-96 hours after online publication and is updated daily on week days.
Initial download of the metrics may take a while.