Fig. 1
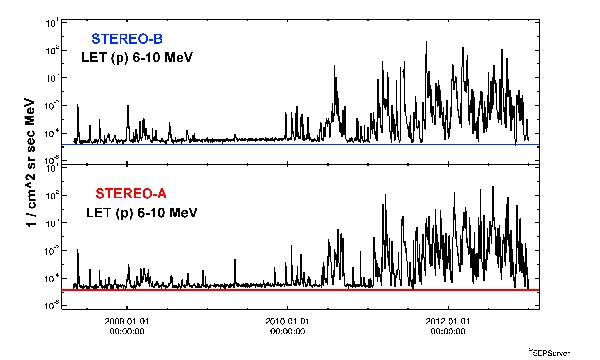
LET proton intensity at the STA and STB spacecraft from 2007 to the end of 2012 (daily averaged), as a function of time. Top panel presents the scanning in LET 6–10 MeV protons recorded by STB, while the bottom panel presents the same survey at STA measurements. See text for details. This figure was created at SEPServer http://server.sepserver.eu.
Current usage metrics show cumulative count of Article Views (full-text article views including HTML views, PDF and ePub downloads, according to the available data) and Abstracts Views on Vision4Press platform.
Data correspond to usage on the plateform after 2015. The current usage metrics is available 48-96 hours after online publication and is updated daily on week days.
Initial download of the metrics may take a while.