| Issue |
A&A
Volume 568, August 2014
|
|
|---|---|---|
| Article Number | A115 | |
| Number of page(s) | 11 | |
| Section | Stellar structure and evolution | |
| DOI | https://doi.org/10.1051/0004-6361/201423452 | |
| Published online | 03 September 2014 | |
Recent activity of the Be/X-ray binary system SAX J2103.5+4545⋆
1 Institut de Ciències de l’Espai, (IEEC-CSIC), Campus UAB, Fac. de Ciències, Torre C5 pa., 08193 Barcelona, Spain
e-mail: This email address is being protected from spambots. You need JavaScript enabled to view it.
2 Instituto de Astrofísica de Canarias, 38200 La Laguna, Tenerife, Spain
3 Universidad de La Laguna, Dept. Astrofísica, 38206 La laguna, Tenerife, Spain
4 Universitat Internacional Valenciana-VIU, Gorgos 5, 46021 Valencia, Spain
5 Instituto de Astrofísica de Andalucía (CSIC), Glorieta de la Astronomía s/n, 18008 Granada, Spain
6 Department of Physics, Middle East Technical University, 06531 Ankara, Turkey
7 Observatorio Astronómico de la Univ. de Valencia, C/Catedrático Jose Beltran, 2, 46980 Paterna (Valencia), Spain
8 Nordic Optical Telescope, Apartado 474, 38700 Santa Cruz de La Palma, Spain
9 Department of Astronomy, Oscar Klein Center, Stockholm University, AlbaNova, 10691 Stockholm, Sweden
10 Physics Department, Süleyman Demirel University, 32260 Isparta, Turkey
11 Czech Technical University in Prague, Faculty of Electrical Engineering, Prague, 166 36 Praha 6, Czech Republic
Received: 17 January 2014
Accepted: 15 June 2014
Abstract
Aims. We present a multiwavelength study of the Be/X-ray binary system SAX J2103.5+4545 with the goal of better characterizing the transient behaviour of this source.
Methods. SAX J2103.5+4545 was observed by Swift/XRT four times in 2007 from April 25 to May 5, and during quiescence in 2012 August 31. In addition, this source has been monitored from the ground-based astronomical observatories of El Teide (Tenerife, Spain), Roque de los Muchachos (La Palma, Spain), and Sierra Nevada (Granada, Spain) since 2011 August, and from the TÜBİTAK National Observatory (Antalya, Turkey) since 2009 June. We performed spectral and photometric temporal analyses to investigate the different states exhibited by SAX J2103.5+4545.
Results. In X-rays, an absorbed power-law model provided the best fit for all the XRT spectra. An iron-line feature at ~6.42 keV was present in all the observations except for that taken during quiescence in 2012. The photon indexes are consistent with previous studies of SAX J2103.5+4545 in high/low-luminosity states. Pulsations were found in all the XRT data from 2007 (2.839(2) mHz; MJD 54 222.02), but not during quiescence. The two optical outbursts in 2010 and 2012 lasted for about eight or nine months (as the one in 2007 probably did and the current one in 2014 might do) and were most probably caused by mass-ejection events from the Be star that eventually fed the circumstellar disc. All of these outbursts started about three months before the triggering of the X-ray activity, and at about the same period before the maximum of the Hα line equivalent width (in emission) was reached at only ~–5 Å. The global correlation between the BV variability and the X-ray intensity was also observed at longer wavelengths in the IR domain.
Key words: accretion, accretion disks / pulsars: individual: SAX J2103.5+4545 / X-rays: binaries / stars: emission-line, Be
Tables 5 and 6 are available in electronic form at http://www.aanda.org
© ESO, 2014
1. Introduction
Accreting X-ray pulsars are binary systems composed of a donor star and an accreting neutron star. In high-mass X-ray binary (HMXB) systems the optical companion can be either a massive early-type supergiant (supergiant systems) or an O, B main-sequence or giant star (BeX binaries; BeXB). Among the most remarkable signatures found in BeXBs are the detection of IR excess and emission-line features in their optical spectra produced in a disc-like outflow around the Be star. Historically, their outbursts have been divided into two classes. Type I (or normal) outbursts normally peak at or close to periastron passage of the neutron star (LX ≤ 1037 erg s-1). Type II (or giant) outbursts reach luminosities of the order of the Eddington luminosity (LX ~ 1038 erg s-1) (Frank et al. 2002), with no preferred orbital phase.
The Be/X-ray binary SAX J2103.5+4545 was discovered with the BeppoSAX satellite (Hulleman et al. 1998), showing X-ray pulsations of ~358 s. The X-ray spectrum (2–25 keV) was fitted by an absorbed power-law with a photon index of 1.27±0.14 (NH = 3.1 × 1022 cm-2). This source has one of the shortest known orbital BeXB periods (~12.68 d) (Baykal et al. 2000). Together with 1A 1118-616 (Staubert et al. 2011), it is the only other system of its type to occupy the region of the wind-fed supergiant binaries in the Pspin − Porb diagram.
The optical counterpart is a B0Ve star (V = 14.2) at a distance between 3.2 and 6.5 kpc (Baykal et al. 2002; Reig et al. 2004). Baykal et al. (2002) found a correlation between spin-up rate and X-ray flux during the 1999 outburst. This suggested the formation of an accretion disc during periastron passage of the neutron star. Later on, using XMM-Newton observations, a quasi-periodic oscillation (QPO) at 22.7 s was discovered by İnam et al. (2004).
SAX J2103.5+4545 shows periodic type I outbursts and stronger events that, despite barely reaching luminosities of the order of 1037 erg s-1, may be called type II outbursts. A recurring characteristic of this source has been the detection of a flare as a precursor of a type II outburst. Two years after its discovery, SAX J2103.5+4545 was found to be active again in 1999 October by the All-Sky Monitor on board RXTE (Baykal et al. 2000). A large flare followed by the main outburst was observed by RXTE in 2001 March (Baykal et al. 2002) and in 2002 June (Baykal et al. 2007; Camero Arranz et al. 2007).
INTEGRAL started observing this source in 2002 December (Lutovinov et al. 2003; Filippova et al. 2004; Blay et al. 2004; Sidoli et al. 2005; Falanga et al. 2005; Camero Arranz et al. 2007; Ducci et al. 2008; Reig et al. 2010). After three years in a low-luminosity state, the source was detected in 2007 April during INTEGRAL observations of the Galactic plane (Galis et al. 2007), anticipating a strong outburst also observed by Swift (Krimm et al. 2007; Kızıloǧlu et al. 2009). Coinciding with the renewed X-ray activity, the optical counterpart showed an Hα line in emission in 2007 May, evidence of disc formation around the Be star (Manousakis et al. 2007; Kızıloǧlu et al. 2009; Reig et al. 2010).
A re-brightening of the Be star in 2010 August indicated an imminent outburst in X-rays (Kiziloglu et al. 2010). The Swift/BAT monitor confirmed a new X-ray episode starting in 2010 October (Krimm et al. 2010). Renewed optical activity was reported in 2012 April (Konstantinova & Blinov 2012). Two months later, the system was detected by INTEGRAL (Sguera et al. 2012). In addition, contemporaneous observations in the JHKs filters showed an IR enhancement, and the Hα line was found in emission (Camero-Arranz et al. 2012). Recently, renewed optical activity of this system has been reported in 2014 March (Konstantinova & Mokrushina 2014). Since April, X-ray activity is also being detected for this system by several X-ray missions. SAX J2103.5+4545 continues in outburst at the moment of writing the present work.
Here, we present a multiwavelength study of SAX J2103.5+ 4545 since 2010. For this purpose we used optical/IR data from our dedicated campaign that involves several ground-based astronomical observatories. In addition, we used various Swift/XRT pointed observations carried out in 2007 and 2012, and survey data from different space-borne telescopes.
2. Observations and data reduction
2.1. Optical and infrared observations
SAX J2103.5+4545 has been continually monitored in the optical and infrared during the period 2011 September to 2014 May with the 80-cm IAC80 and with the 1.5 m TCS telescopes at the Observatorio del Teide on Tenerife (Spain). In the optical, we obtained CCD images in the B and V bands with integration times of 30 s. In infrared, J, H and K-short simultaneous observations were performed using the CAIN camera with integration times of 150 s. All images were reduced in the standard way using the pipelines available for both telescopes. We applied straightforward aperture photometry using apertures of 1.5 times the full width at half maximum (FWHM). Several comparison stars within the field of view were checked for variability during each night and throughout the entire data set. Calibration of the optical data was performed using the zero-point magnitude offsets and extinction coefficients listed for the Observatorio del Teide. Infrared data were calibrated using the 2MASS survey as a photometric reference. Figure 1 summarizes the time span of these observations (see also Tables 5 and 6).
In addition, photometric data covering 2009 June 18 to 2012 November 15 were obtained with the 0.45 m ROTSEIIId1 telescope at the TÜBİTAK National Observatory (Antalya, Turkey), which operates without filters with a wide pass-band peaking at 5500 Å (Akerlof et al. 2003). Reference stars located in the surroundings of the optical counterpart of the system, CSC 03588–00834, were selected; they showed relatively constant magnitudes (see Table 1) in the ROTSEIIId pass-band. To obtain the differential magnitudes for the Be star we subtracted the reference star magnitude from the Be star magnitudes (see Sect. 3.1). More details on the reduction of the ROTSEIIId data can be found in Kızıloǧlu et al. (2005).
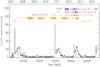 |
Fig. 1 Swift/BAT light curve (15–50 keV) with a bin size equal to the 12.67 d orbital period. Tick marks on the segments located above the light curve denote the times of the Swift/XRT pointing observations (green), as well as the optical/IR photometric data from the ground-based telescopes ROTSEIIId (orange), IAC80 (blue), and TCS (red). The optical spectroscopic observations come from OSN (purple), NOT (yellow), and RTT150 (light red) (see also Table 2). |
Selected photometric reference stars in the neighbourhood of the optical counterpart of SAX J2103.5+4545 (GSC 03588-00834) with the ROTSEIIId telescope.
Hα line equivalent width (EW) measurements for SAX J2103.5+4545.
Optical spectroscopic observations, covering the period from 2010 August to 2014 January (see Fig. 1 and Table 2), were obtained from three different telescopes: the 2.56 m Nordic Optical Telescope (NOT) located at the Observatorio del Roque de los Muchacho (La Palma, Spain), the 1.5-m Telescope at the Observatorio de Sierra Nevada (OSN-CSIC) in Granada (Spain), and the Russian-Turkish 1.5 m telescope (RTT150) at the TÜBİTAK National Observatory in Antalya (Turkey).
The spectra from NOT were obtained with the Andalucía Faint Object Spectrograph and Camera ALFOSC2, using grism 7, with a dispersion of 1.5 Å/pixel, and 0.5′′–1′′ slits, whereas the low-resolution OSN spectra were acquired using the Albireo spectrograph. The Albireo spectra have a resolution of R ≈ 1400 and are centred on the Hα. We reduced this data set using standard procedures within IRAF3, including bias subtraction, removal of pixel-to-pixel sensitivity variations, optimal spectral extraction, and wavelength calibration based on arc-lamp spectra. Finally, the spectroscopic data from RTT150 were obtained with the TÜBİTAK Faint Object Spectrometer (TFOSC), which is equipped with a 2048×2048, 15 μm pixel Fairchild 447BI CCD. We used grism 8, which has an average dispersion of 1.4 Å/pixel and a 67 μm slit (1.24′′), providing a 5800–8300 Å wavelength coverage. The RTT150 spectra was reduced using the long-slit package of MIDAS4. We corrected bias and flat-field and removed cosmic-ray hits with standard MIDAS routines. All spectroscopic data were normalized with a spline fit to continuum and corrected to the heliocentre after the wavelength calibration. The full width at half maximum and equivalent width (EW) measurements were acquired by fitting Gaussian functions to the Hα profiles using the ALICE subroutine of MIDAS.
Log of the Swift/XRT observations.
2.2. X-ray observations
SAX J2103.5+4545 was observed by Swift/XRT (Gehrels et al. 2004; Burrows et al. 2005) four times from 2007 April 25 (MJD 54 215.4) to 2007 May 5 (MJD 54 225.1), and once again in 2012 August 31 (MJD 56 170.4) for a total exposure time of 8.56 ks and 3.13 ks. Some of these observations were performed in photon-counting (PC) mode (2.5 s time resolution, 2D Image) and/or in windowing timing (WT) mode (1.7 ms time resolution, 1D image). Figure 1 and Table 3 provide the log of these observations.
For all the observations screened event files were created with the xrtpipeline tool (HEAsoft version 6.13), and the events were converted into the solar system barycentre. Only XRT data in PC mode suffered from pile-up (see Table 3). We thus extracted source events from an annulus circle region of 30 pixels outer radius (1 pixel = 2.36′′) and 3 pixels inner radius. The background was extracted by selecting a larger region of ~60 pixel radius, but far from the source. For the WT observations we extracted source events from a box (30×15 pixel) region of the 1D image, centred on the pixel with the highest rate. The background was chosen by using two segments on both sides of the source, but far enough so that they were not contaminated by source photons. The spectra were then generated using xselect. The ancillary response matrix was created using the xrtmkarf task. The relevant response matrix to use is given by the HEASARC’s calibration database (CALDB5). We also used for comparison data products supplied by the UK Swift Science Data Centre at the University of Leicester (Evans et al. 2009).
Since 2008, the Gamma-ray Burst Monitor (GBM) on board the Fermi satellite has been monitoring SAX J2103.5+4545. In this study we used timing products provided by the GBM pulsar team (see e.g. Finger et al. 2009; Camero-Arranz et al. 2010, for a detailed description of the timing technique). We also used quick-look X-ray results provided by the RXTE All Sky Monitor team6, and Swift/BAT transient-monitor results provided by the Swift/BAT team (Krimm et al. 2013).
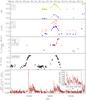 |
Fig. 2 Optical/IR and X-ray evolution of SAX J2103.5+4545. The time bin for the BAT light curve is 2 days. There is a notable correlation between the variability in the optical/IR and X-ray bands. The correlation of the X-ray flux with the 12.7 orbital period (only during bright state) can be better appreciated in the small panel which displays a zoom of the 2012 X-ray outburst. |
3. Results
3.1. Optical and IR photometry
The results of our multiwavelength campaign are shown in Fig. 2. In this figure the optical/IR behaviour of the Be star is shown, together with the X-ray activity observed from the neutron star (see Tables 5 and 6). A correlation between the variability in the optical and IR bands and the X-ray intensity is clearly noticeable.
From top to bottom, the fourth panel of the same figure shows a steady increase in the ROTSEIIId optical differential magnitude from 2010 May to August (MJD ~55 320–55 410). The rise in the brightness of the Be star indicated the beginning of the optical outburst, which approximately peaked on 2010 November 20 (MJD ~ 55 520) and most probably ended around 2011 April. About three months after the optical reawakening, the X-ray activity was triggered with a large flare, followed by periodic 12.67 d X-ray outbursts overlapping the increased X-ray emission for about 6–7 months (see bottom panel).
According to the evolution of the BVJHKs magnitudes (see the first and second panels of Fig. 2), SAX J2103.5+4545 exhibited a steady trend from 2011 November to 2012 March (MJD ~55 835–56 000). Both optical and IR brightenings then took place; they peaked around 2012 July (MJD 56 130) and finished by November (MJD ~56 245). At that point, the system resumed its quiescent state (see fourth panel of the same figure). About three months after the triggering of the optical and IR activity a large X-ray flare took place in 2012 May/June (MJD ~ 56 070), followed by the same behaviour pattern previously observed in 2010 and 2007. The compact object returned to quiescence ~7 months later. Renewed optical/IR activity of this system started most likely in 2014 February. About 2–3 months later, X-ray activity was detected for this system by Swift/BAT7 and Fermi/GBM8.
This shows that the two optical outbursts in 2010 and 2012 lasted for about 8 or 9 months, and the Be star reached maximum brightness after X-ray maximum. At this moment, although the current behaviour of this source so far resembles the activity displayed in 2012, the intensity in the BV filters is slightly brighter than before. As in Kızıloǧlu et al. (2009), we searched for periodicity in the ROTSEIIId light curve, but nothing was observed on shorter time scales. All the available data for this source in this band show that the recurrence of the optical outbursts is highly variable. The time span is ~5 to ~3 yr (see also Reig et al. 2010; Kızıloǧlu et al. 2009), or, more recently, shorter than 2 yr.
On average, the brightening of the system in the IR was about 1.4 mag. In the optical band the amplitude was ~0.6 mag for the 5500 Å band-pass, and 0.4 mag for the BV filters. This confirms the increasing trend in the amplitude of this variation with wavelength, which has been interpreted as a contribution from the Be star’s disc (Reig et al. 2010, and references therein).
3.2. Hα line
The emission lines in the spectra of Be stars arise from recombination in a circumstellar disc, while absorption profiles originate in the photosphere. The exact date on which the Hα line changed from being in absorption to being in emission (see third panel of Figs. 2, 3, and Table 2) is not clear from our data. However, from our data for 2010 September and 2012 March we found that a circumstellar disc around the Be star was already present. In 2012, the INTEGRAL satellite reported renewed X-ray activity from this source around two months after the detection of the Hα line in emission (Camero-Arranz et al. 2012, and references therein).
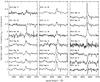 |
Fig. 3 Hα line profile evolution for SAX J2103.5+454. The intensity of each profile was normalized and scaled by adding a constant. |
In 2012, the Hα EW showed a sudden rise at the time of the X-ray flare and remained practically constant for about one month. The EW increased afterwards, finally peaking in 2012 October. In contrast, the available spectroscopic data from 2007 (Reig et al. 2010) show that the Hα EW did not remain flat during the X-ray flare, but showed an initial peak before reaching maximum in 2007 September. Therefore, the amount of mass ready to be transferred from the disc to the neutron star was most probably lower during the 2012 X-ray flare, and in turn the flare was weaker. Our next measurement of the EW in 2012 December (MJD 56 272.7) confirmed a dramatic decrease in the size of the Be disc, recovering a value similar to that of the initial steady period. The Hα line has been found in absorption since 2013 September up to recently.
In Fig. 3 we show the evolution in the shape of this line. We see only absorption profiles at the beginning and the end of the optical/IR activity, an indication that no disc was present. The shape of the Hα line is highly variable, with some emission profiles showing asymmetric single- and double-peaked shapes. In addition, double-peaked profiles merged into a single peak as the EW/luminosity increase.
For the typical double-peaked emission lines, the heights of the violet and redshifted peaks are designated as V and R, respectively (Porter & Rivinius 2003). Figure 4 shows the V/R ratios of the Hα line for SAX J2103.5+4545 since 2010 September (see also Table 2). Although the coverage of the data is non-uniform, the former figure reveals very rapid changes on short time-scales. The most remarkable change occurred towards the end of the growing cycle of the disc. Around 2012 September 15, the V/R ratio changed by a factor of ~2.5 within a day.
We also measured the distance between the V and R peaks – that is, ΔV – of the Hα emission line by fitting two Gaussian functions to the profiles (see Table 2). Figure 4 shows the evolution of ΔV during the most recent active period in 2012. Initially, ΔV decreases as the EW increases exponentially (see also the third panel of Fig. 2). A sudden increase in ΔV was then observed around 2012 September 9 (MJD 56 179), decreasing afterwards. This rapid change took place almost at the same time as the one observed in the V/R ratios. It seems that the Be disc might have been truncated at that time.
It is known that Be stars are rapid rotators, and that their rotational velocities can be measured either using HeI lines between 4026–4471 Å (Steele et al. 1999) or Hα lines. We used Hα measurements to find the projected rotational velocity (v sin i) of this source, since our data do not cover the blue part of the spectrum. Hanuschik (1989) derived the relation between Hα widths and rotational velocity as follows: log[FWHM(Hα)/1.23 v sin i + 70] = −0.08 log EW(Hα) + 0.14, where EW and FWHM are in Å, and v sin i are in km s-1 (see Table 2). Using the average EW and FWHM values of the Hα line, we calculated the projected rotational velocity of SAX J2103.5+4545 as v sin i ~ 292 km s-1, which is of the same order as the value of 240 km s-1 reported by Reig et al. (2004).
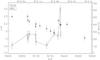 |
Fig. 4 V/R ratios (open squares) of the Hα line during the most recent period of activity in 2012. Rapid changes in the temporal V/R evolution can be observed. The peak separation ΔV (stars) is also overplotted. |
3.3. X-ray activity
3.3.1. Spectral analysis
To obtain the 0.3–10 keV phase-averaged spectrum for the XRT observation during quiescence in 2012 we used source and background photons extracted as described in Section 2.2. For the present analysis we used the XSPEC package (version 12.8.0j; Arnaud 1996). Despite the poor statistics, an absorbed power-law (PL) model was found to be the best fit to the quiescent spectrum. For the photoelectric absorption we used the cross-sections from Balucinska-Church & McCammon (1992) and the solar abundance from Anders & Grevesse (1989). The best-fit parameters for this model are NH< 0.02 × 1022 cm-2 (this parameter was poorly constrained, being compatible with zero), and Γ = 2.8 ± 0.8 (C-stat = 184.7 for 162 d.o.f.). Results from data in PC and WT modes were found to be compatible within the uncertainties. The 2–10 keV observed flux was FX = 0.005(2) × 10-10 erg cm-2 s-1. The rightmost column of Table 4 contains the main spectral parameters obtained (ObsID 005).
To study the spectral evolution of SAX J2103.5+4545, we fitted the spectra from 2007, again with an absorbed PL model (see Fig. 5), since this provided the best results. We added an iron-line feature at ~6.42 keV, which had previously been observed in this source (see Table 4). We fixed the width of iron line to the obtained value to better constrain the errors in its energy. In the 2–10 keV range the observed flux was FX = 10.4(2), 12.2(1), 5.9(1), and 4.9(1) × 10-10 erg cm-2 s-1 for ObsIds 001, 002, 003, and 004, respectively. The observed flux in the 0.5–10 keV band dropped from 1.08(2) × 10-9 erg cm-2 s-1 at the maximum of the 2007 flare to 0.0020(5) × 10-9 erg cm-2 s-1 during the quiescent state in 2012. In addition, we froze the NH during quiescence using average values that ranged from 0.5 to 0.8 × 1022 cm-2, which resulted in even poorer fits (e.g. C-stat/d.o.f. = 218.3/163 for NH = 0.8 × 1022 cm-2) than that in which all the parameters were set free (C-stat/d.o.f. = 184.7/162). We also found a remarkable deviation of the model with respect to the data points at low energies. We would like to point out that the poor quality of this spectrum is probably not only related to the very low flux level of the source (~0.074 mCrab), but also to the fact that this short ~3 ks observation was taken in WT mode, which is more suitable for timing analysis and for source fluxes between 1–600 mCrab.
The photon indexes (Γ < 1) are consistent with the values previously reported for SAX J2103.5+4545 when it was at high luminosities (İnam et al. 2004; Baykal et al. 2002, 2007; Filippova et al. 2004; Camero Arranz et al. 2007; Reig et al. 2010). At low states, our value of the photon index during quiescence is slightly higher than previous measurements, although still compatible taking into account the uncertainties.
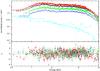 |
Fig. 5 Swift/XRT spectra for all the observations. For clarity, the spectra have been grouped with a minimum of 25 counts per bin. ObsID 001 data poins are denoted as black circles, ObsID 002 as red triangles, ObsID 003 as light green stars, ObsID 004 as dark blue open squares, and ObSID 005 as turquoise diamonds. |
Best spectral parameters from an absorbed PL model plus a Gaussian iron line.
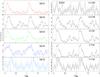 |
Fig. 6 Left: Swift/XRT pulse profiles in the 0.3–10 keV energy band for all the observations. Right: pulse profiles (in counts s-1) in different energy bands for the observation at higher luminosity – ObsID 002 (energy increasing from top to bottom). |
3.3.2. Timing analysis and results
Figure 1 shows the most recent X-ray activity of SAX J2103.5+ 4545 observed by Swift/BAT. The light curve (binned using the 12.67 d orbital period) shows the common feature for this source, a pre-outburst peak or flare that precedes all type II outbursts and lasting a few orbits. Since 2007 the peak intensity of these flares has decreased over time, while main outbursts reached approximately the same magnitude and duration (~7 months). As seen in the optical band, the time span between X-ray type II outbursts was notably different, namely ~2.7 yr between 2007 and 2010, and ~0.7 yr between 2010 and 2012. Periodic X-ray activity was not observed during quiescence, in agreement with previous results during quiescent states (e.g. Baykal et al. 2002; Reig et al. 2005; Camero Arranz et al. 2007; Kızıloǧlu et al. 2009; Reig et al. 2010).
To study the evolution of the pulse frequency of SAX J2103.5+4545 we started our search for pulsations in the data set from 2007. For the frequency extraction we used the Fourier analysis module included in the Period04 software package9 (Lenz & Breger 2005). The Fourier analysis in Period04 is based on a discrete Fourier-transform algorithm. The uncertainties in the frequency determinations are computed from Monte Carlo simulations.
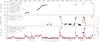 |
Fig. 7 Top: long-term spin frequency history of SAX J2103.5+4545 since its discovery in 1997. To visualize this plot more clearly we do not display the results from Baykal et al. (2002, 2007), our first XRT frequency determination from Table 3, and some values from Sidoli et al. (2005). Middle: long-term optical light curve of this source. Bottom: history of the outbursts during the same period. The peak intensities of the different outbursts are only intended to be illustrative of the times and types of events since they have not been corrected for the different energy bands. The long-term evolution of the Hα EW (blue triangles, stars, and filled circles) is also overplotted. |
The main problem we faced was the red noise that contaminated the space adjacent to the source’s pulse period, which made it very difficult precisely determinate this pulse. Therefore we limited our search to a narrow frequency range centred on the values reported by Ducci et al. (2008) (~2.835 mHz) using INTEGRAL data from the same period. We then fitted a sinusoid to a combination of the observed frequency and its second harmonic to obtain the best estimate for each XRT observation. This process yielded consistent frequency determinations of 2.834 ± 0.022 mHz, 2.835 ± 0.011 mHz, 2.839 ± 0.002 mHz, and 2.832±0.004 mHz for the four observations from 2007 (see also Table 3). The corresponding pulse periods are 352.8 ± 2.7 s, 352.7 ± 1.3 s, 352.2 ± 0.2 s, and 353.0 ± 0.5 s.
In addition, we proceeded with folding the source events using the best frequency estimate obtained for each observation. The left panel of Fig. 6 shows the pulse profiles during the 2007 flare (epoch increasing from top to bottom). The profiles show a strong peak at phases ~0−0.4 (becoming wider in observations at lower luminosities) and secondary weaker structures (here only found in observations ObsID 002 and 003) that cover the remaining phases and decrease as the energy increases (see Fig. 6). In ObsID 002, although the two most prominent secondary peaks at phases ~0.6–0.8 and ~0.8–1 decreased as the energy increases, a small portion at phases 0.8–0.9 remained noticeable. On the other hand, all these weaker structures varied with time and seemed to be uncorrelated with luminosity. This confirms the known highly variable pulse profile behaviour of SAX J2103.5+4545 (Camero Arranz et al. 2007), whereas a good description of the processes responsible for the complex shape at low energies is still lacking.
Fermi/GBM detected pulsations from SAX J2103.5+4545 at the beginning of the flare on 2010 October 12 (MJD 55 481.4), at a frequency of 2.8390(3) mHz (Pspin = 352.23(4) s). The spin frequency increased at a rate of 2.3146912(1) × 10-12 Hz s-1 (Ṗ ~ − 2.9 × 10⁻⁷ s s-1) during the flare from October 12 to 27 (see Fig. 7). Between the 2010 and 2012 X-ray outbursts the spin frequency appears to increase smoothly at a rate of 0.66367141(3) × 10-13 Hz s-1 (Ṗ ~ − 8.2 × 10⁻⁹ s s-1). In contrast, between 2012 and 2014 this source did spin down at a rate of ~1.5 × 10⁻¹³ Hz s-1 (Ṗ ~ 1.8 × 10⁻⁹ s s-1). Then SAX J2103.5+4545 spun up at a rate of ~4.9 × 10⁻¹² Hz s-1 (Ṗ ~ − 6.1 × 10⁻⁷ s s-1) during the first three days of the flare occurred in 2014.
In the present study, no pulsations were detected in the XRT observation during quiescence from 2012 May 2. One month later, Fermi/GBM detected SAX J2103.5+4545 at a frequency of 2.8454(3) mHz (Pspin = 351.44(4) s) on 2012 June 9 (MJD 56 087.6). From 2012 June 9 to August 26 the spin-up rate was 3.96(14) × 10-13 Hz s-1. We made an attempt to fold the source events using the GBM pulse detection and found that a single-peak component might be the main feature (see bottom panel of Fig. 6).
The modulation amplitude of the 0.3–10 keV pulses presented in the left panel of Fig. 6 can be measured using a pulse fraction defined as PF = Fmax − Fmin/Fmax + Fmin, where Fmax and Fmin are the maximum and minimum flux in the pulse profile, respectively. We found PF values of 33(4)%, 41(6)%, 37(5)%, 31(6)%, and 64(35)% (<2σ) for ObsID 001 to 005, respectively (see also Table 3). Since this definition may add any noise present in the light curve to the true pulse fraction, thereby tending to increase the resulting measurement, we used a more robust estimate of the PF, that is, the rms pulsed fraction defined as PF![Mathematical equation: \hbox{$_{\rm rms}=1/\bar{y}\,[1/n \sum\limits_{i=1}^n (y_{i}-\bar{y})^{2} -\sigma^2]^{1/2}$}](/articles/aa/full_html/2014/08/aa23452-14/aa23452-14-eq136.png) , where n is the number of phase bins per cycle, yi is the number of counts in the ith phase bin, σi is the error on yi, and
, where n is the number of phase bins per cycle, yi is the number of counts in the ith phase bin, σi is the error on yi, and  is the mean number of counts in the cycle. We obtained PFrms values of 19(5)%, 23(4)%, 20(3)%, 14(2)% for ObsID 001 to 004, respectively. However, for the observation during quiescence this definition did not yield a real solution. Finally, regarding the evolution of the PFrms with energy we obtained values of 21(3)%, 28(5)%, 41(6)%, 57(4)%, and 39(2)% for ObsID 002 in the 0.3–0.9 keV, 0.9–2.5 keV, 2.5–5 keV, 5–7.5 keV, and 7.5–10 keV energy bands, respectively.
Furthermore, we studied the transient 22.7 s QPO detected in an XMM-Newton observation from 2003 January 6 (İnam et al. 2004). We did not find any QPO around 0.044 Hz in the power spectral density of the 0.3–10 keV source events for any of the XRT observations. A single power-law provided a good fit to the power spectra from 2007. The power-law indexes were 1.8(1), 1.4(2), 1.3(6), and 1.9(6) for ObsID 001 to 004, respectively. These values are all practically compatible within the uncertainties, and also with the values obtained by Reig et al. (2010) with RXTE /PCA during the high state of SAX J2103.5+4545.
4. Discussion
4.1. Long-term Be-disc/neutron star interaction
In this study we have confirmed the correlation between BV variability and X-ray intensity for SAX J2103.5+4545. Furthermore, we have found that this correlation extends to longer wavelengths in the IR domain. The optical and IR brightening of the Be star seems to precede the appearance of episodes of high X-ray luminosity (and neutron star spin-up), in addition to moderate values of the Hα line EW in emission. This behaviour has been observed in other BeXRBs; for instance, in EXO 2030+375 (Wilson et al. 2008).
Figures 2 and 7 corroborate that the optical outbursts of SAX J2103.5+4545 started about three months before the X-ray activity (see also Kızıloǧlu et al. 2009). These episodes may be explained as mass-ejection events from the donor star that will provide the material for the Be disc formation (see e.g. Yan et al. 2012, for A 0535+26). We found the same type of behaviour in the IR for observations from 2012, which we interpreted as reprocessing in the Be disc. The brightening events of 2010 and 2012 lasted for about eight or nine months, and so probably did that in 2007. The current activity exhibited by SAX J2103.5+4545 resembles the behaviour displayed in 2012. The model of Okazaki & Negueruela (2001) ascribes the origin of X-ray outbursts to the truncation of the Be circumstellar disc at a resonance radius between the disc Keplerian velocity and the orbit of the neutron star. Whether or not type I or II outbursts are produced depends on the eccentricity of the system as the disc expands and contracts between different resonant radii. This would explain the correlation between the disc status as inferred from Hα EW and profile, and the presence or absence of X-ray outbursts in SAX J2103.5+4545.
The relatively low peak value of the Hα line EW in emission indicates a small Be disc truncated by the neutron star through its short orbit. The distance between the V and R peaks of the Hα line can be regarded with the measure of the Hα emitting region of the disc for a Be star (Huang 1972): (Δ V/ 2 v sin i) = (Rdisk/R∗)− j, where j = 0.5 for Keplerian rotation (j = 1 from the angular momentum conservation), Rdisk is the radius of Hα emitting region, and R∗ denotes the radius of the central star. Taking the average value of ΔV (381.12 km s-1) and the previously found rotational velocity for this source (see Sect. 3.2), the size of the Hα emitting region of SAX J2103.5+4545 is found to be Rdisc ~ 2.35 R∗, compatible with Reig et al. (2010). Furthermore, the radius of the Be disc of SAX J2103.5+4545 was found to be similar to the size of the Roche lobe and similar to the periastron distance (Reig et al. 2010), which probably propitiated the formation of sudden and strong X-ray flares when the neutron star made direct contact with the Be disc during periastron passages.
Kriss et al. (1983) proposed an alternative view of the enhancement of the optical activity for the Be/X-ray binary system 4U 0115+63 during an outburst in 1980. They suggested that the increase of optical light was created by material already transferred from the Be star to the vicinity of the neutron star, and that it was radiating because of viscous heating in an accretion disc. For SAX J2103.5+4545, no X-rays were observed before 2012 May/June, which means that the transferred material must have been stored in an accretion disk since 2012 March. The delay of ~90–100 days before the X-ray outburst would then represent the time scale for the material to move inward through the accretion disk to the neutron star surface under the action of viscous forces. We can estimate the viscosity parameter α in the steady-state α-disc model (Shakura & Sunyaev 1973; Novikov & Thorne 1973). The time scale given by Novikov & Thorne (1973) is δt = 210α− 4/5(M∗/ 1 M⊙)1/4(Ṁ/ 10-10M⊙ yr-1)−3/10 (Rd/1011 cm)5/4 days, where M∗ is the mass of the neutron star, Ṁ is the accretion rate, and Rd is the outer radius of the accretion disk. We can estimate the accretion rate from the observed X-ray luminosity during the outburst. Assuming a distance range of 3.2–6.5 kpc, a 10 km neutron star radius, a mass of 1.4 M⊙, and an energy conversion efficiency of 0.5 (Baykal et al. 2002), we obtain Ṁ = 0.4–1.5 × 10⁻⁹M⊙ yr-1. Expressing the disc size in terms of the viscosity parameter (where α< 1) gives an upper limit of the disc size of the order of Rd = (δt/A)4/5 × 1011 cm (with A = 156 or 102 for each distance estimate, respectively), that is, Rd = 6–9 × 1010 cm. Although the delay between the optical/IR and X-ray outbursts can be explained in this context, it is still difficult to explain why the optical/IR outbursts lasted for about nine months, while the X-ray outburst only lasted about six months. If matter was present in the accretion disc for this entire time, the X-ray outburst should have had a duration similar to the optical/IR events. One possibility is that the accretion disc was not a stable feature in the system. Instead, there might have been a sudden inflow of disc material onto the neutron star after the disc had reached some critical configuration, as suggested by Kriss et al. (1983) for 4U 0115+63. This has been predicted in accretion discs in white-dwarf systems, although not in neutron-star systems. For SAX J2103.5+4545 maybe only part of the material was initially transferred to the vicinity of the neutron star. This scenario may be supported by the evolution of the Hα EW. From the fourth panel of Fig. 2 we see that a very small Be disc was still present and showed a stable size (for about four months) at the same time that the maxima of the optical and IR brightening episodes were reached. After this period, however, instead of fading with the optical and IR magnitudes, the Be disc suddenly started to grow and doubled its size to its maximum of ~1.7 × 1012 cm in about three months. This is difficult to reconcile in terms of this alternative scenario. Therefore, we conclude that most likely a Be disc was gradually formed after a mass-ejection event, and then part of the matter was eventually transferred to the neutron star which caused the X-ray outburst.
With this we restrict the time-scale upper limit of the creation and disintegration of the Be disc to ~10 months, the shortest known for BeXB because of its narrow orbit. From Table 2 we see that in 2012 the Hα line EW in emission reached its maximum in ~6.5 months (from MJD 56 013.89–56 210.02). Since the X-ray activity was triggered around MJD 56 050 (~36 days after the Hα was found in emission), this means that it most probably took no more than those ~6.5 months for the disc to grow. Two months later, in 2012 December (MJD 56 272.2) the disc was still present, but shortened. Although we found this line in absorption in the next available data in 2013 September (MJD 56 543.79), from the X-ray observations we can infer that the transient disc was already absent ~1.6 months later (around MJD 56 320). Analysis of data from 2007 led Reig et al. (2010) to reach similar conclusions and find a time-scale of ~1.3–1.5 yr.
This source is also particular because of the variability observed in the strength and shape of the Hα line (see Fig. 3). Asymmetric line profiles may arise owing to one-armed density waves in the circumstellar disc, as suggested by the global disc-oscillation model (Okazaki 1997; Papaloizou & Savonije 2006). Furthermore, cyclic changes in the V/R ratio observed in many stars were also found to be consistent with the presence of a one-armed density wave in the disc precessing around the central star (Porter & Rivinius 2003). In this study, we observed rapid V/R ratio variations in SAX J2103.5+4545 (see Fig. 4); however, our sample did not allow us confidently to predict a cyclic pattern. Furthermore, rapid changes in line profile types are explained as the result of dynamical effects due to the misalignment of the disc orbital plane and the stellar equator (see Porter & Rivinius 2003). Recent studies propose that density changes in the disc thermal structure may be the origin as well (Silaj et al. 2010, and references therein).
4.2. X-ray behaviour
The spectral variability of SAX J2103.5+4545 has been studied in detail by different authors, confirming the softening of this source as the flux decreased. Baykal et al. (2007) suggested that this type of spectral softening with decreasing flux was mainly a consequence of a change in the mass accretion rate. In particular, Reig et al. (2010, and references therein) explained that increased mass-accretion rates are expected to result in harder X-ray spectra because of Comptonization processes. From the Swift/XRT observations we saw a dramatic decrease of the X-ray luminosity of SAX J2103.5+4545 from 2007 to 2012. Assuming a 6.5 kpc distance (Reig et al. 2004), the luminosity dropped from ~7 to ~0.01 × 1036 erg s-1. Similar values have previously been observed at high states (Galis et al. 2007; Baykal et al. 2007; Camero Arranz et al. 2007; Kızıloǧlu et al. 2009; Reig et al. 2010). The quiescent luminosity observed from this source with RXTE/PCA is of the order of our XRT determination.
SAX J2103.5+4545 has shown a spin frequency increase since 1997 (see Fig. 7), occasionally interrupted by short spin-down intervals (e.g. middle panel of Fig. 12 of Camero-Arranz et al. 2007), corresponding to low accretion rates. We stress that this source has always been detected in all the available RXTE/PCA observations from 2000 to 2004. The longest spin-up period occurred between 2002 and 2004 (MJD 52 445.90–52 707.37), the most active so far, at a net rate of  Hz s-1 (Ṗ ~ − 8.2 × 10⁻⁸ s s-1). A torque/luminosity correlation was inferred from these observations, suggesting that there is an accretion disc around the neutron star. This was later confirmed by the detection of a QPO in the XMM-Newton data (İnam et al. 2004). All our pulse frequency measurements of SAX J2103.5+4545 during the 2007 X-ray flare are compatible within the uncertainties, and also with the values reported by Ducci et al. (2008) made using INTEGRAL data. Ducci et al. (2008) detected a similar spin-up trend for 12 days during the 2007 flare with
  Hz s-1 (Ṗ ~ − 3.4 × 10⁻⁷ s s-1). On the other hand, our uncertainties do not allow us to distinguish any significant spin-up or down tendency. Fermi/GBM observed a spin-up rate (~2.3 × 10⁻¹² Hz s-1; Ṗ ~ − 2.9 × 10⁻⁷ s s-1) during approximately the 15 days that the 2010 flare lasted, and a similar spin-up (~2.6 × 10⁻¹² Hz s-1; Ṗ ~ − 3.2 × 10⁻⁷ s s-1) within the first six days of the 2012 flare. During the first three days of the flare that occurred in 2014, the spin-up reached a value of ~4.9 × 10⁻¹² Hz s-1 (Ṗ ~ − 6.1 × 10⁻⁷ s s-1). These spin-up to X-ray flux correlations (see also Fig. 7) suggest that an accretion disc around the neutron star was also present in the X-ray events from 2007 until 2014.
Photometric and spectroscopic observations performed in 2004 (Reig et al. 2005) during the faint state showed that SAX J2103.5+4545 continued to emit X-rays even after having completely lost the Be disc. A gradual flux decline was also seen during quiescence after the type II outburst in 2004, but the frequency continued to increase (see Fig 7). This was unusual, but it has been seen in other wind-fed systems (Bildsten et al. 1997). It was then proposed that, since SAX J2103.5+4545 is located in the region of wind-fed supergiant binaries in the Pspin–Porb or Corbet diagram, accretion from the stellar wind of the companion might be the origin of the observed luminosity. On the other hand, the random X-ray variability typical of wind-fed systems caused by wind inhomogeneities is absent from SAX J2103.5+4545. Reig et al. (2010) proposed the more stable equatorial low-velocity high-density wind characteristic of BeXB as the dominant accretion wind.
The evolutionary sequence that a neutron star will follow as it spins down from periods that are initially very short (P ≪ 1 s) to moderate (P ≳ 10 s) or long (P ≳ 100 s) periods have been discussed in several works (see e.g. Davies & Pringle 1981; Henrichs 1983). Four distinct phases of neutron star spin-down in close binary systems have been proposed to be applicable to a particular range of rotation periods: pulsar-like, very rapid rotator, supersonic propeller, and subsonic propeller (Davies & Pringle 1981). According to these long-period neutron stars such as SAX J2103.5+4545 achieve the most effective braking during the subsonic propeller regimen, in which the rotational rate decelerates because of the interaction between the magnetosphere and the surrounding hot, quasi-static plasma envelope (Ikhsanov & Choi 2006). While SAX J2103.5+4545 was in a low state, between the 2004 December and 2007 April outbursts, Ducci et al. (2008) measured a spin-down of  Hz s-1 (Ṗ ~ 5.5 × 10⁻⁹ s s-1). RXTE/PCA observations from very low luminosity periods show that this source span down at similar rates (from ~−2 to −0.2 × 10⁻¹³ Hz s-1) (Baykal et al. 2007; Camero Arranz et al. 2007). Based on our observations during the same quiescent period,
  Hz s-1 (Ṗ ~ 5.9 × 10⁻⁹ s s-1). Assuming that in quiescence SAX J2103.5+4545 enters the subsonic propeller regime, it is expected to spin down at a rate of
  , where μ is the neutron star magnetic moment, M the mass (1.4 M⊙), and I the moment of inertia (Henrichs 1983). If we select the two reported values of the magnetic field for SAX J2103.5+4545 – that is, B = 1.65 × 10¹² G (Sidoli et al. 2005) and 16.5 × 10¹² G (Baykal et al. 2007) – then
  and −1.5 × 10⁻¹³ Hz s-1, respectively. Therefore, comparing these results with our observations, the behaviour of this source during quiescence may be understood only by assuming B = 16.5 × 10¹² G.
5. Summary
We have presented the results of our multiwavelength campaign for the Be/X-ray binary system SAX J2103.5+4545. We performed spectral and photometric temporal analyses to investigate the transient behaviour exhibited by this source since 2007. These new observations were place in the context of historical data and discussed in terms of the neutron star Be-disc interaction. The X-ray spectral analysis of observations during active periods and quiescence supports previous findings for this system. In particular, the photon indexes were consistent with SAX J2103.5+4545 being at high and low-luminosity states. Pulsations were found only in the data from 2007, but not during quiescence. Our timing analyses results also support the presence of a transient accretion disc around the neutron star during periods of major activity (each event lasting about 6 or 7 months since 2007). The optical outbursts in 2010 and 2012 lasted for about eight or nine months (as that in 2007 probably did, and as will probably be the case for that in 2014), and were most probably due to mass-ejection events from the Be star. Thanks to our long-term IR monitoring of this source, a correlation between the IR variability and the X-ray intensity was found. The IR enhancement episode of 2012 extended for the same period of time as in the optical band. The optical/IR outbursts started about three months before the triggering of the X-ray activity. However, the optical/IR brightness and the Hα EW were anti-correlated; that is, the maximum of the EW of this line was reached during the decline of the brightness of the BVJHKs magnitudes. We confined the disc formation and disintegration process to within about 10 months. We only observed Hα line profiles in absorption at the beginning and end of the optical and IR activity, an indication that no disc was present around the Be star. We observed fast Hα line variability and asymmetric double and single profiles in emission during the evolution of the Be disc. This behaviour might be explained in terms of one-armed density waves in the circumstellar disc.
Online material
Log of the optical photometric observations of SAX J2103.5+4545 with the IAC80 telescope.
IR photometric observations of SAX J2103.5+4545 with the TCS telescope.
The Robotic Optical Transient Search Experiment, ROTSE, is a collaboration of Lawrence Livermore National Lab, Los Alamos National Lab, and the University of Michigan (http://www.rotse.net).
The data presented here were obtained (in part) with ALFOSC, which is provided by the Instituto de Astrofísica de Andalucía (IAA) under a joint agreement with the University of Copenhagen and NOTSA.
IRAF is distributed by the National Optical Astronomy Observatory, optical images which is operated by the Association of Universities for Research in Astronomy (AURA) under cooperative agreement with the National Science Foundation.
Acknowledgments
This article is partially based on service observations made with the IAC80 and TCS telescopes operated on the island of Tenerife by the Instituto de Astrofísica de Canarias (IAC) in the Spanish Observatorio del Teide. The authors are grateful to the IAC support astronomers and the telescope operators for having made the observations with the IAC facilities. The present work is also based on observations made with the Nordic Optical Telescope, operated by the Nordic Optical Telescope Scientific Association at the Observatorio del Roque de los Muchachos (IAC), La Palma, Spain. The Albireo spectrograph at the 1.5 m telescope is operated by the Instituto de Astrofísica de Andalucía at the Sierra Nevada Observatory. M.Ö.A. acknowledges support from TÜBİTAK, The Scientific and Technological Research Council of Turkey, through the research project 106T040. We thank TÜBİTAK and ROTSE collaboration for partial support in using the RTT 150 and ROTSEIIId Telescopes with project numbers TUG-RTT150.08.45, 12ARTT150-264-1 and ROTSE-40. We also thank Ü. Kızıloǧlu for providing all the available ROTSE data on SAX J2103.5+4545 for this study. We thank H. BilalÖzcan for the most recent optical spectroscopic observations obtained with the RTT150. We appreciate to A. Papitto for useful discussions about spin-down processes in neutron stars systems. We also acknowledge Terry Mahoney for revising the English text. This study made use of data supplied by the UK Swift Science Data Centre at the University of Leicester. The work of J.G.S. is supported by the Spanish Programa Nacional de Astronomía y Astrofísica under contract AYA2012-39246-C02-01. E.N. acknowledges a VALi+d postdoctoral grant from the Generalitat Valenciana and was supported by the Spanish Ministry of Economy and Competitiveness under contract AYA 2010-18352. M.C.G. is supported by the European social fund within the framework of “Support of inter-sectoral mobility and quality enhancement of research teams at Czech Technical University in Prague”, CZ.1.07/2.3.00/30.0034. A.C. was supported by the AYA2012-39303, SGR2009-811 and iLINK2011-0303 grants.
References
- Akerlof, C. W., Kehoe, R. L., McKay, T. A., et al. 2003, PASP, 115, 132 [NASA ADS] [CrossRef] [Google Scholar]
- Anders, E., & Grevesse, N. 1989, Geochim. Cosmochim. Acta, 53, 197 [Google Scholar]
- Arnaud, K. A. 1996, in Astronomical Data Analysis Software and Systems V, eds. G. H. Jacoby, & J. Barnes, ASP Conf. Ser., 101, 17 [Google Scholar]
- Balucinska-Church, M., & McCammon, D. 1992, ApJ, 400, 699 [NASA ADS] [CrossRef] [Google Scholar]
- Baykal, A., Stark, M. J., & Swank, J. 2000, ApJ, 544, L129 [NASA ADS] [CrossRef] [Google Scholar]
- Baykal, A., Stark, M. J., & Swank, J. H. 2002, ApJ, 569, 903 [NASA ADS] [CrossRef] [Google Scholar]
- Baykal, A., Inam, S. Ç., Stark, M. J., et al. 2007, MNRAS, 374, 1108 [NASA ADS] [CrossRef] [Google Scholar]
- Bildsten, L., Chakrabarty, D., Chiu, J., et al. 1997, ApJS, 113, 367 [NASA ADS] [CrossRef] [Google Scholar]
- Blay, P., Reig, P., Martínez Núnez, S., et al. 2004, A&A, 427, 293 [NASA ADS] [CrossRef] [EDP Sciences] [Google Scholar]
- Blay, P., Negueruela, I., Reig, P., et al. 2006, A&A, 446, 1095 [NASA ADS] [CrossRef] [EDP Sciences] [Google Scholar]
- Burrows, D. N., Hill, J. E., Nousek, J. A., et al. 2005, Space Sci. Rev., 120, 165 [NASA ADS] [CrossRef] [Google Scholar]
- Camero Arranz, A., Wilson, C. A., Finger, M. H., & Reglero, V. 2007, A&A, 473, 551 [NASA ADS] [CrossRef] [EDP Sciences] [Google Scholar]
- Camero-Arranz, A., Finger, M. H., Ikhsanov, N. R., et al. 2010, ApJ, 708, 1500 [NASA ADS] [CrossRef] [Google Scholar]
- Camero-Arranz, A., Nespoli, E., Gutierrez-Soto, J., & Zurita, C. 2012, ATel, 4187, 1 [NASA ADS] [Google Scholar]
- Davies, R. E., & Pringle, J. E. 1981, MNRAS, 196, 209 [NASA ADS] [CrossRef] [Google Scholar]
- Ducci, L., Sidoli, L., Paizis, A., et al. 2008, in Proc. of the 7th INTEGRAL Workshop [Google Scholar]
- Evans, P. A., Beardmore, A. P., Page, K. L., et al. 2009, MNRAS, 397, 1177 [NASA ADS] [CrossRef] [Google Scholar]
- Falanga, M., di Salvo, T., Burderi, L., et al. 2005, A&A, 436, 313 [NASA ADS] [CrossRef] [EDP Sciences] [Google Scholar]
- Filippova, E. V., Lutovinov, A. A., Shtykovsky, P. E., et al. 2004, Astron. Lett., 30, 824 [NASA ADS] [CrossRef] [Google Scholar]
- Finger, M. H., Beklen, E., Narayana Bhat, P., et al. 2009 [arXiv:0912.3847] [Google Scholar]
- Frank, J., King, A., & Raine, D. J. 2002, Accretion Power in Astrophysics: Third Edition [Google Scholar]
- Galis, R., Beckmann, V., Bianchin, V., et al. 2007, ATel, 1063, 1 [NASA ADS] [Google Scholar]
- Gehrels, N., Chincarini, G., Giommi, P., et al. 2004, ApJ, 611, 1005 [NASA ADS] [CrossRef] [Google Scholar]
- Hanuschik, R. W. 1989, Ap&SS, 161, 61 [NASA ADS] [CrossRef] [Google Scholar]
- Hanuschik, R. W., Kozok, J. R., & Kaiser, D. 1988, A&A, 189, 147 [NASA ADS] [Google Scholar]
- Henrichs, H. 1983, Accretion-Driven Stellar X-ray sources (Cambrige Univ. Press), 393 [Google Scholar]
- Huang, S.-S. 1972, ApJ, 171, 549 [NASA ADS] [CrossRef] [Google Scholar]
- Hulleman, F., in ’t Zand, J. J. M., & Heise, J. 1998, A&A, 337, L25 [NASA ADS] [Google Scholar]
- Ikhsanov, N. R., & Choi, C.-S. 2006, Adv. Space Res., 38, 2901 [NASA ADS] [CrossRef] [Google Scholar]
- İnam, S. Ç., Baykal, A., Swank, J., & Stark, M. J. 2004, ApJ, 616, 463 [Google Scholar]
- Kızıloǧlu, Ü., Kızıloǧlu, N., & Baykal, A. 2005, AJ, 130, 2766 [NASA ADS] [CrossRef] [Google Scholar]
- Kızıloǧlu, Ü., Özbilgen, S., Kızıloǧlu, N., & Baykal, A. 2009, A&A, 508, 895 [NASA ADS] [CrossRef] [EDP Sciences] [Google Scholar]
- Kiziloglu, U., Kiziloglu, N., Baykal, A., & Inam, S. C. 2010, ATel, 2925, 1 [NASA ADS] [Google Scholar]
- Konstantinova, T. S., & Mokrushina, A. A. 2014, ATel, 6019, 1 [NASA ADS] [Google Scholar]
- Krimm, H. A., Barthelmy, S. D., Barbier, L., et al. 2007, ATel, 1064, 1 [NASA ADS] [Google Scholar]
- Krimm, H. A., Barthelmy, S. D., Baumgartner, W., et al. 2010, ATel, 2928, 1 [NASA ADS] [Google Scholar]
- Krimm, H. A., Holland, S. T., Corbet, R. H. D., et al. 2013, ApJS, 209, 14 [NASA ADS] [CrossRef] [Google Scholar]
- Kriss, G. A., Cominsky, L. R., Remillard, R. A., et al. 1983 ApJ, 266, 806 [NASA ADS] [CrossRef] [Google Scholar]
- Lenz, P., & Breger, M. 2005, Commun. Asteroseismol., 146, 53 [NASA ADS] [CrossRef] [Google Scholar]
- Lutovinov, A. A., Molkov, S. V., & Revnivtsev, M. G. 2003, Astron. Lett., 29, 713 [Google Scholar]
- Manousakis, A., Reig, P., & Kougentakis, A. 2007, ATel, 1085, 1 [NASA ADS] [Google Scholar]
- Novikov, I. D., & Thorne, K. S. 1973, Black Holes (Les Astres Occlus), eds. C. Dewitt, & B. S. Dewitt (New York: Gordon & Breach), 343 [Google Scholar]
- Okazaki, A. T. 1997, A&A, 318, 548 [NASA ADS] [Google Scholar]
- Okazaki, A. T., & Negueruela, I. 2001, A&A, 377, 161 [NASA ADS] [CrossRef] [EDP Sciences] [Google Scholar]
- Papaloizou, J. C. B., & Savonije, G. J. 2006, A&A, 456, 1097 [NASA ADS] [CrossRef] [EDP Sciences] [Google Scholar]
- Porter, J. M., & Rivinius, T. 2003, PASP, 115, 1153 [NASA ADS] [CrossRef] [Google Scholar]
- Reig, P., Negueruela, I., Fabregat, J., et al. 2004, A&A, 421, 673 [NASA ADS] [CrossRef] [EDP Sciences] [Google Scholar]
- Reig, P., Negueruela, I., Papamastorakis, G., et al. 2005, A&A, 440, 637 [NASA ADS] [CrossRef] [EDP Sciences] [Google Scholar]
- Reig, P., Słowikowska, A., Zezas, A., & Blay, P. 2010, MNRAS, 401, 55 [NASA ADS] [CrossRef] [Google Scholar]
- Sguera, V., Drave, S., Goossens, M., et al. 2012, ATel, 4168, 1 [NASA ADS] [Google Scholar]
- Shakura, N. I., & Sunyaev, R. A. 1973 A&A, 24, 337 [NASA ADS] [Google Scholar]
- Sidoli, L., Mereghetti, S., Larsson, S., et al. 2005, A&A, 440, 1033 [NASA ADS] [CrossRef] [EDP Sciences] [Google Scholar]
- Silaj, J., Jones, C. E., Tycner, C., et al. 2010, ApJS, 187, 228 [NASA ADS] [CrossRef] [Google Scholar]
- Staubert, R., Pottschmidt, K., Doroshenko, V., et al. 2011, A&A, 527, A7 [NASA ADS] [CrossRef] [EDP Sciences] [Google Scholar]
- Steele, I. A., Negueruela, I., & Clark, J. S. 1999, A&AS, 137, 147 [NASA ADS] [CrossRef] [EDP Sciences] [Google Scholar]
- Wilson, C. A., Finger, M. H., & Camero-Arranz, A. 2008, ApJ, 678, 1263 [NASA ADS] [CrossRef] [Google Scholar]
- Yan, J., Li, H., & Liu, Q. 2012, ApJ, 744, 37 [NASA ADS] [CrossRef] [Google Scholar]
All Tables
Selected photometric reference stars in the neighbourhood of the optical counterpart of SAX J2103.5+4545 (GSC 03588-00834) with the ROTSEIIId telescope.
Log of the optical photometric observations of SAX J2103.5+4545 with the IAC80 telescope.
All Figures
|
Fig. 1 Swift/BAT light curve (15–50 keV) with a bin size equal to the 12.67 d orbital period. Tick marks on the segments located above the light curve denote the times of the Swift/XRT pointing observations (green), as well as the optical/IR photometric data from the ground-based telescopes ROTSEIIId (orange), IAC80 (blue), and TCS (red). The optical spectroscopic observations come from OSN (purple), NOT (yellow), and RTT150 (light red) (see also Table 2). |
| In the text | |
|
Fig. 2 Optical/IR and X-ray evolution of SAX J2103.5+4545. The time bin for the BAT light curve is 2 days. There is a notable correlation between the variability in the optical/IR and X-ray bands. The correlation of the X-ray flux with the 12.7 orbital period (only during bright state) can be better appreciated in the small panel which displays a zoom of the 2012 X-ray outburst. |
| In the text | |
|
Fig. 3 Hα line profile evolution for SAX J2103.5+454. The intensity of each profile was normalized and scaled by adding a constant. |
| In the text | |
|
Fig. 4 V/R ratios (open squares) of the Hα line during the most recent period of activity in 2012. Rapid changes in the temporal V/R evolution can be observed. The peak separation ΔV (stars) is also overplotted. |
| In the text | |
|
Fig. 5 Swift/XRT spectra for all the observations. For clarity, the spectra have been grouped with a minimum of 25 counts per bin. ObsID 001 data poins are denoted as black circles, ObsID 002 as red triangles, ObsID 003 as light green stars, ObsID 004 as dark blue open squares, and ObSID 005 as turquoise diamonds. |
| In the text | |
|
Fig. 6 Left: Swift/XRT pulse profiles in the 0.3–10 keV energy band for all the observations. Right: pulse profiles (in counts s-1) in different energy bands for the observation at higher luminosity – ObsID 002 (energy increasing from top to bottom). |
| In the text | |
|
Fig. 7 Top: long-term spin frequency history of SAX J2103.5+4545 since its discovery in 1997. To visualize this plot more clearly we do not display the results from Baykal et al. (2002, 2007), our first XRT frequency determination from Table 3, and some values from Sidoli et al. (2005). Middle: long-term optical light curve of this source. Bottom: history of the outbursts during the same period. The peak intensities of the different outbursts are only intended to be illustrative of the times and types of events since they have not been corrected for the different energy bands. The long-term evolution of the Hα EW (blue triangles, stars, and filled circles) is also overplotted. |
| In the text | |
Current usage metrics show cumulative count of Article Views (full-text article views including HTML views, PDF and ePub downloads, according to the available data) and Abstracts Views on Vision4Press platform.
Data correspond to usage on the plateform after 2015. The current usage metrics is available 48-96 hours after online publication and is updated daily on week days.
Initial download of the metrics may take a while.