Free Access
Fig. 4
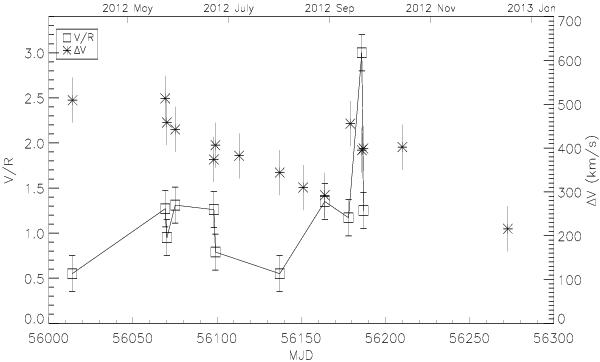
V/R ratios (open squares) of the Hα line during the most recent period of activity in 2012. Rapid changes in the temporal V/R evolution can be observed. The peak separation ΔV (stars) is also overplotted.
Current usage metrics show cumulative count of Article Views (full-text article views including HTML views, PDF and ePub downloads, according to the available data) and Abstracts Views on Vision4Press platform.
Data correspond to usage on the plateform after 2015. The current usage metrics is available 48-96 hours after online publication and is updated daily on week days.
Initial download of the metrics may take a while.