Fig. 2
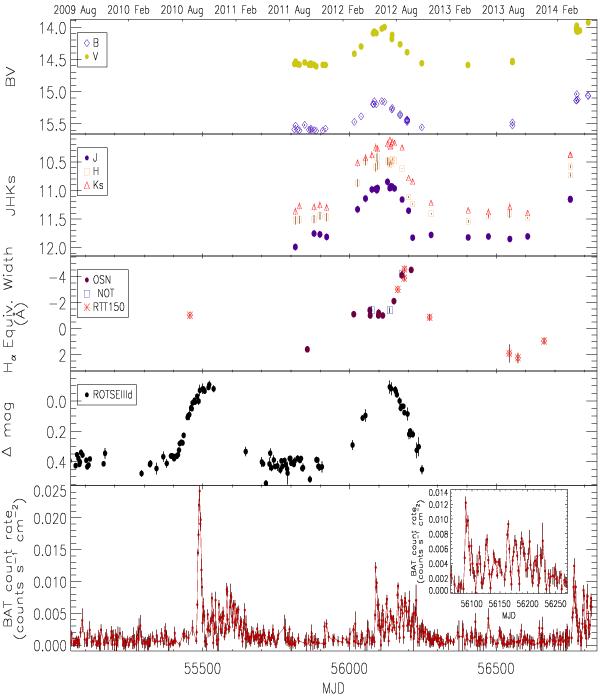
Optical/IR and X-ray evolution of SAX J2103.5+4545. The time bin for the BAT light curve is 2 days. There is a notable correlation between the variability in the optical/IR and X-ray bands. The correlation of the X-ray flux with the 12.7 orbital period (only during bright state) can be better appreciated in the small panel which displays a zoom of the 2012 X-ray outburst.
Current usage metrics show cumulative count of Article Views (full-text article views including HTML views, PDF and ePub downloads, according to the available data) and Abstracts Views on Vision4Press platform.
Data correspond to usage on the plateform after 2015. The current usage metrics is available 48-96 hours after online publication and is updated daily on week days.
Initial download of the metrics may take a while.