Fig. 7
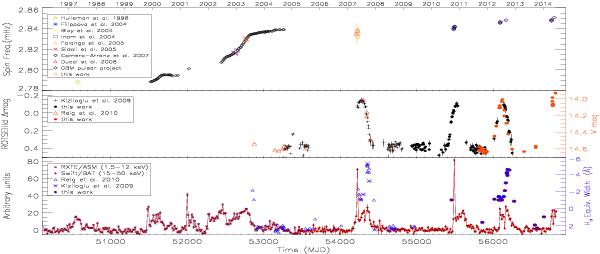
Top: long-term spin frequency history of SAX J2103.5+4545 since its discovery in 1997. To visualize this plot more clearly we do not display the results from Baykal et al. (2002, 2007), our first XRT frequency determination from Table 3, and some values from Sidoli et al. (2005). Middle: long-term optical light curve of this source. Bottom: history of the outbursts during the same period. The peak intensities of the different outbursts are only intended to be illustrative of the times and types of events since they have not been corrected for the different energy bands. The long-term evolution of the Hα EW (blue triangles, stars, and filled circles) is also overplotted.
Current usage metrics show cumulative count of Article Views (full-text article views including HTML views, PDF and ePub downloads, according to the available data) and Abstracts Views on Vision4Press platform.
Data correspond to usage on the plateform after 2015. The current usage metrics is available 48-96 hours after online publication and is updated daily on week days.
Initial download of the metrics may take a while.