| Issue |
A&A
Volume 567, July 2014
|
|
|---|---|---|
| Article Number | L4 | |
| Number of page(s) | 4 | |
| Section | Letters | |
| DOI | https://doi.org/10.1051/0004-6361/201424243 | |
| Published online | 04 July 2014 | |
Smooth X-ray variability from ρ Ophiuchi A+B
A strongly magnetized primary B2 star?
1 INAF-Osservatorio Astronomico di Palermo, Piazza del Parlamento 1, 90134 Palermo, Italy
e-mail: This email address is being protected from spambots. You need JavaScript enabled to view it.
2 Smithsonian-Harvard Center for Astrophysics 60 Garden St, Cambridge MA 02138, USA
Received: 20 May 2014
Accepted: 23 June 2014
Abstract
X-rays from massive stars are ubiquitous yet not clearly understood. In an XMM-Newton observation devoted to observing the first site of star formation in the ρ Ophiuchi dark cloud, we detect smoothly variable X-ray emission from the B2IV+B2V system of ρ Ophiuchi. We tentatively assign the emission to the primary component. The light curve of the pn camera shows a first phase of low, almost steady rate, then a rise phase of duration of 10 ks, followed by a high rate phase. The variability is seen primarily in the band 1.0−8.0 keV while little variability is detected below 1 keV. The spectral analysis of the three phases reveals the presence of a hot component at 3.0 keV that adds up to two relatively cold components at 0.9 keV and 2.2 keV. We explain the smooth variability with the emergence of an extended active region on the surface of the primary star as being due to its fast rotation (vsin i ~ 315 km s-1). We estimate that the region has a diameter in the range 0.5−0.6 R∗. The hard X-ray emission and its variability hint at a magnetic origin, as suggested for a few other late-O through early-B type stars. We also discuss an alternative explanation based on the emergence from occultation of a young (5−10 Myr) low mass companion that is bright and hot in X-rays.
Key words: stars: early-type / stars: activity / stars: magnetic field / stars: individual:ρOphiuchi / starspots
© ESO, 2014
1. Introduction
X-ray emission is a common feature among massive stars of spectral types O through early B. In single O-stars, a soft X-ray emission is thought to be generated by shocks in the stellar winds accelerated by the strong X-UV stellar flux in a non linear mechanism called line de-shadowing instability (LDI, Owocki et al. 1988; Feldmeier et al. 1997a,b). In strongly magnetized massive early-type stars, winds can be channeled and collide at high Mach numbers generating hard X-ray emission (Babel & Montmerle 1997; ud-Doula & Owocki 2002). In binary systems, large-scale shocks associated with wind-wind collisions can manifest themselves in additional X-ray emission (Stevens et al. 1992). Examples of variability from colliding winds on a time scale of a few years synchronized with the orbital period of O-type binaries are observed in three systems of the Cyg OB2 complex (Cazorla et al. 2014).
The origin of magnetic fields in O and B stars is thought to reside either in a dynamo mechanism at the interface between convective core and radiative layers (although it is still difficult to model the buoyancy of the magnetic field), or it has a fossil origin being the ambient magnetic field from the parent cloud trapped and compressed during the formation of the star, with some subsequent dynamo driven amplification (Walder et al. 2012). In both cases, the magnetic fields likely have a main dipolar component although more complex configurations can be present. In this framework, the origin of X-rays from stellar winds is less probable in B type stars because of their weaker winds with respect to those of O and WR stars. The rate of detection in X-rays among B stars falls to about 50% (Wolk et al. 2011; Nazé et al. 2011; Rauw et al. 2014) and hard X-ray emission in a few cases are a signature of the presence of strong magnetic fields. Significant examples of X-ray emitters among late O- early B type stars are τ Sco (Cohen et al. 2003), β Crucis (Cohen et al. 2008), ζ Puppis (Nazé et al. 2013), and θ1 Ori C (Gagné et al. 1997). The detection of spots on the surface of late O/early B-type stars has been reported in X-ray band by Gagné et al. (1997) on θ1 Ori C (O7 V, rotation period p = 15.4) with ROSAT, and recently by Fossati et al. (2014) in two early B-type stars of the NGC 2264 star forming region. Another case of modulated variability and hard X-ray spectrum in early B-type star which hints at a magnetic origin is σ Ori E (Skinner et al. 2008). Here we report on X-rays from ρ Ophiuchi, a binary system at a distance of ~111 pc from the Sun, composed of a B2IV star and a B2V star (Abt 2011; van Leeuwen 2007). The separation between the two stellar components is about 2.8″ or 310 AU at a distance of 111 pc, and the orbital period is ~2000 years. The star ρ Ophiuchi sits about 1deg north of the dense core of active star formation L 1688, and gives it the name “the ρ Ophiuchi dark cloud complex”. About 300 members in various stages of formation – from Class 0/I to Classes II and III – belong to L 1688 (Wilking et al. 2008) at an average distance of 120−130 pc. A ring of dust visible in far to mid infrared and with radius ~40′ (1.4 pc) surrounds ρ Ophiuchi and was possibly formed by the winds of the central binary system. In this area a number of pre-main-sequence stars have formed and are very likely coeval to ρ Ophiuchi. We observed ρ Ophiuchi with XMM-Newton for a duration of ~53 ks in order to identify and to study this first episode of star formation likely triggered by the ρ Ophiuchi system itself. Indeed, we discovered a group of about 25 young low mass stars around ρ Ophiuchi that are older (~5 Myr, Pillitteri et al., in prep.) than the embedded population in L1688 (<1 Myr).
2. X-ray light curve and spectra
The XMM-Newton observation was taken on August 29, 2013, for a nominal duration of ~53 ks. The Thick filter was used for the EPIC exposures in order to prevent damage to the instruments and to avoid UV contamination from ρ Ophiuchi, which has magnitude V = 5.05. The data sets were analyzed with SAS version 13.5, starting from the Observation Data Files and reducing them to obtain calibrated event lists in the 0.3−8.0 keV band for MOS and pn cameras, including a filtering of events for PATTERN <4 and FLAG <0.
Optical positions of the components of the ρ OphiuchiA+B system and of the X-ray centroid.
We detected copious X-ray emission from the ρ Ophiuchi system. Given the spatial resolution of the EPIC camera and the errors associated with the positions of the X-ray sources we cannot firmly distinguish between the X-ray emission of ρ Ophiuchi A and B (see Table 1 for the positions of the components of ρ Ophiuchi system). The Point Spread Function (PSF) of EPIC is about 4.4″ (FWHM), the calibration of absolute astrometry has nominally zero systematic shift and less than 0.8″ of error. Relative astrometry of EPIC has uncertainties of less than 1.2″. The positional uncertainty for ρ Ophiuchi from the wavelet detection code (Damiani et al. 1997b,a) is <1″. We expect that the combination of these sources of astrometric uncertainties amount to ≤2″. A visual inspection of the MOS 1 image shows that the centroid of the emission is closer to the optical position of ρ Ophiuchi A (Fig. 2), thus we tentatively assign the X-ray emission and its features to the primary star.
Rho Ophiuchi was observed with XMM-Newton without interruption for about 53 ks. The background rate was generally low, but elevated during the last 5 ks. Data acquired during the high background interval were filtered out only to improve the source detection process and to maximize the signal-to-noise ratio of the faintest sources. Here we considered the full length exposure. In the pn light curve of ρ Ophiuchi we recognize three phases (Fig. 1): a first phase of relatively low rate (median pn rate: 182 ct/ks, median MOS 1 rate: 62 ± 12 ct/ks; median MOS 2 rate: 63 ± 12 ct/ks, all rates given in 0.3−8.0 keV band), a second phase of gradual increase of the rate lasting about 10 ks, and then a third phase of high rate (median pn rate 280 ct/ks; median MOS 1 rate: 95 ± 12 ct/ks; median MOS 2 rate: 91 ± 6 ct/ks, all rates given in 0.3−8.0 keV band). A small amount of flickering at the level of one sigma is visible on top of the average flux during the whole observation. The light curves in the soft (0.3−1.0 keV) and hard (>1 keV) bands show that the increase of flux is essentially observed in the hard band.
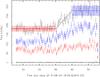 |
Fig. 1 pn light curve of ρ Ophiuchi in broadband (0.3−8 keV), hard band (blue, >1 keV), soft band (red, <1.0 keV), and background. The events are extracted from a circular region centered on the X-ray centroid position (see Table 1) and of radius 16″. We observe three phases in ρ Ophiuchi curve: a low rate phase (0−30 ks), a rise phase (30−40 ks), and a high rate phase (>40 ks). The rate in the quiescent phase has a median value of ~182 ct/ks with a mean absolute deviation (MAD, marked by the red shaded area) of 15 ct/ks. High phase rate has a median rate of 280 ct/ks with MAD = 27 ct/ks (blue shaded area). The change in the rate is mostly seen above 1 keV, while the soft-band rate remains almost constant. |
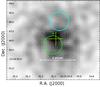 |
Fig. 2 Mos 1 image and positions of the two components of ρ Ophiuchi system, A and B. The original image is binned in blocks of size 0.2″ × 0.2″, and smoothed with a Gaussian kernel of 3 pixels. The color scale is linear. The cross marks the position of the X-ray centroid and gives a visual estimate of the positional uncertainty. The circles have radii of 1″ to account for the precision of the optical positions. Although we cannot separate X-ray emission of both components, the centroid of the emission appears closer to the A component. |
We analyzed the MOS 1, MOS 2, and pn spectra from the time interval in 0−30 ks, 30−40 ks, and 40−60 ks in order to identify spectral changes. The best fit parameters are shown in Table 2. During the initial low rate phase, a best fit to the spectrum is obtained with a sum of two thermal APEC components plus global absorption. The temperatures are kT1 = 0.9 keV and kT2 = 2.2 keV with the hot component accounting for about 30% of the total plasma emission measure.
For the best fit of the rise and the high rate phases, we added a third component to the 2T model used for the low rate spectrum. Our hypothesis is that a hot component appears gradually on the visible face of the star during the rise, and remains visible during the high rate phase. The two components of the low rate phase were kept fixed while we allowed only the temperature of the hot component and its normalization to vary. Plasma as hot as 3.0−3.4 keV is found during the rise and the high rate phase. The temperatures of the third hot component, estimated during the rise and high rate intervals, are consistent with each other within one σ, reinforcing the scenario of a hotter region emerging in the visible part of the primary star. The change of flux is manifested by a gradual increase of the emission measure of the hot plasma component, which increases from 5.1 × 1052 cm-3 to 9.7 × 1052 cm-3. This is fully compatible with the hypothesis of a region brighter and hotter than the average stellar surface that gradually appears on the visible side of the star during the rise of the count rate. The flux varies by a factor of 40% going from low rate to high rate phases.
Compared to the B stars in the Carina region, ρ Ophiuchi is quite peculiar with regard to its X-ray properties. Gagné et al. (2011) find that B stars in Carina with X-ray luminosity higher than LX ≥ 1031 erg s-1 have a hard spectrum (kT> 1 keV) while B stars with LX< 1031 erg s-1 have softer spectra (kT< 0.6 keV). Despite its relatively low X-ray luminosity (LX ~ 1030 erg s-1), the spectrum of ρ Ophiuchi is quite hard during the low rate phase (kT2 ~ 2 keV) and becomes even harder during the rise and high rate phase (kT3 ~ 3.0 − 3.4 keV).
Stelzer et al. (2005) report the case of three late-O to early-B type stars from the Chandra Orion Ultra-deep Project (COUP) sample that exhibit periodic X-ray variability phased with the rotational stellar period. The hardness ratios of these stars are periodic as well with the hardest spectrum corresponding to the highest rate as we find in ρ Ophiuchi.
For further comparison, we analyzed the EPIC spectra of HIP 100751 (α Pavonis) which is also a B2IV star in a binary system and recently observed by XMM-Newton (ObsId: 0690680201, P.I.: W. Waldron). The light curve of HIP 100751 shows brief impulsive variability, more typical of young solar mass stars, and perhaps originated by the unresolved stellar companion. The spectrum of HIP 100751 is quite soft (Fig. 3, bottom panel); the best fit is obtained with two thermal APEC components at kT1 = 0.4 keV and kT2 = 0.8 keV, with the cold component emission measure being 70% of the total emission measure, and the total X-ray luminosity is 2.6 × 1028 erg s-1 in the 0.3−8.0 keV band. We conclude that ρ Ophiuchi is thus more luminous than HIP 100751 and it has a harder spectrum, reinforcing the peculiarity of ρ Ophiuchi.
Parameters of the best fit models to the pn spectra in the three different temporal phases.
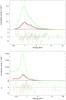 |
Fig. 3 Top figure: EPIC MOS 1 (black), MOS 2 (red), and pn (green) spectra of ρ Ophiuchi during the high rate phase (top panel) and χ2 terms (bottom panel). The APEC components are plotted with dotted lines. A high temperature of ~3 keV is detected during the rise and the high rate phase. Bottom figure: same plot for HIP 100751. We note the harder spectrum of ρ Ophiuchi compared to HIP 100751. The spectra are accumulated from the same events selected for the light curve (see Fig. 1). |
3. Discussion and conclusions
The X-ray variability and the hardness of the X-ray spectrum of ρ Ophiuchi make this star interesting in the context of X-ray emission from massive stars. We observed ρ Ophiuchi in X-rays with XMM-Newton and we found a smooth increase of the X-ray flux above 1 keV. We tentatively assign the whole X-ray emission to the primary component given the shorter distance of the X-ray flux centroid from its optical position. However, the low spatial resolution of the EPIC camera compared to the separation of the two components of the system (~2.8″) does not determine the source of X-rays precisely.
We observe a low rate phase followed by a smooth rise and a high rate state. A first possible interpretation of this behavior is that the increase of rate is due to a hot active region emerging from the limb on the stellar surface because of the rotation of the star. We measured the rotational broadening v sini of ρ Ophiuchi A from the width of the He I line at 6678 Å in an archival UVES spectrum, obtaining a value of vsin i ~ 315 km s-1 in agreement with literature values (vsini ~ 300 km s-1). Given a duration of the rise phase of about 10 ks, we estimated a diameter of the active region on the equator of the star of about 3.15 × 10⁶ km. This size corresponds to about 0.5−0.6 × R∗, and thus the active region is quite large. The active region could be at the equator or at any higher stellar latitude and its origin is likely due to a strong magnetic field. If the magnetic field has a main dipolar shape then an oblique magnetic rotator is involved and the spot is at high latitude. Were the spot at the equator, a more complex toroidal field would have to be involved. Rho Ophiuchi is not the first case of spotted B stars as spots have been identified in other B-early stars, e.g., two young B2 stars in NGC 2264 (Fossati et al. 2014), as we observed before. In these two cases, the magnetic origin of the surface spots is inferred by means of spectropolarimetric observations, with magnetic fields of a few hundred Gauss in intensity and configurations as simple and double dipoles, respectively. Fossati et al. (2014) discuss the origin of such magnetic fields, preferring the hypothesis of a merging event during the star formation rather than a fossil origin. The relevance of ρ Ophiuchi in this context is that its close distance allows further detailed investigations.
Another explanation for the smooth variability is that a low mass unknown companion of ρ Ophiuchi A appears and bears an additional flux with intrinsic harder emission. The companion could emerge from behind the primary, which would account for the rise phase during the two limb contacts. Given the difference of flux between low and high state, its luminosity should be LX ~ 1.1 × 1030 erg s-1, which is on the median X-ray luminosity of young X-ray bright stars that we detected around ρ Ophiuchi (median LX ~ 1.25 × 1030 erg s-1). In a simplistic hypothesis, at 1 AU the Keplerian orbital velocity is ~89 km s-1, and considering a 10 ks time for the full disk appearance, a radius of 0.6R⊙ is derived. The radius of the companion is inversely proportional to the period (i.e., if r = 0.5 R⊙, P ≃ 50 days), while its mass does not play a role. Very little constraint on mass and radius comes from the value of X-ray luminosity that this companion should bear (LX = 1.1 × 1030 erg s-1). Because of the saturation of LX expected at this age (5−10 Myr) for G − K stars (Pizzolato et al. 2003; Jardine & Unruh 1999; Favata & Micela 2003) the presence of a relatively small companion like a early K-type star is plausible. A very close companion coeval with ρ Ophiuchi should experience its X-ray luminosity enhanced by the likely spin-orbit locked rotation and thus values of LX ~ 1030 erg s-1 could be observed in such object. A main drawback for this scenario is the lack of enhancement of the soft emission (e.g., below 1 keV) due to the unknown companion (see Fig. 1). It is quite unlikely that the spectrum of this stellar object is hard or that is heavily absorbed by intervening material. The absorption toward ρ Ophiuchi is indeed quite moderate (NH ~ 3.4 × 1021 cm-2) and soft emission during the low state interval is detected.
Rho Ophiuchi could be similar to the very young system of Oph S 1, which is likely constituted by a B-type star and an unknown low mass companion. Oph S 1 is known to emit variable X-rays and is a compact radio source (André et al. 1988; Hamaguchi et al. 2003; Gagné et al. 2004). However, unlike ρ Ophiuchi, in Oph S 1 the thick cocoon that shrouds the central objects could have a significant role in shaping the radio and X-ray emission, likely because of the infalling circumstellar material or the interaction of the stellar winds and stellar magnetic field with the surrounding material.
We find even less likely that an X-ray variability arises from colliding winds between the two components of the system, given the weak winds expected from the two B2 stars and their separation. A marked dropoff of the X-ray flux is observed around spectral type B1 marking a change in the mechanisms of
production of X-rays from stellar winds (Cassinelli et al. 1994; Cohen et al. 1997). ρ Ophiuchi does not fit into this observational evidence. In this respect, given its relatively close distance, ρ Ophiuchi is one of the best targets for further investigation of any weak X-ray emission from colliding winds originated from the region between the two components of the system.
In summary, we have presented results of the first pointed X-ray observation of the young B-star binary system ρ Ophiuchi A+B which reveal clear variability on a timescale of a few hours that is likely associated with magnetic activity, with some other low-level flickering possibly present on shorter timescales. These results, along with detections of similar X-ray variability in a few other young B stars, lend support to the presence of magnetic fields in early B stars. However, in the case of Rho Oph AB, X-ray observations at higher spatial resolution are needed to more accurately determine the position of the X-ray centroid relative to the two closely-spaced B star components and to confirm that the X-ray emission is entirely due to the primary.
Acknowledgments
I.P. acknowledges Dr. Mario Guarcello and Dr. Javier Lopez-Santiago for the helpful discussions on the topics of this paper. I.P. acknowledges financial support of the European Union under the project “Astronomy Fellowships in Italy” (AstroFit). S.J.W. was supported by NASA contract NAS8-03060.
References
- Abt, H. A. 2011, AJ, 141, 165 [NASA ADS] [CrossRef] [Google Scholar]
- André, P., Montmerle, T., Feigelson, E. D., Stine, P. C., & Klein, K.-L. 1988, ApJ, 335, 940 [NASA ADS] [CrossRef] [Google Scholar]
- Babel, J., & Montmerle, T. 1997, ApJ, 485, L29 [NASA ADS] [CrossRef] [Google Scholar]
- Cassinelli, J. P., Cohen, D. H., Macfarlane, J. J., Sanders, W. T., & Welsh, B. Y. 1994, ApJ, 421, 705 [NASA ADS] [CrossRef] [Google Scholar]
- Cazorla, C., Nazé, Y., & Rauw, G. 2014, A&A, 561, A92 [NASA ADS] [CrossRef] [EDP Sciences] [Google Scholar]
- Cohen, D. H., Cassinelli, J. P., & Macfarlane, J. J. 1997, ApJ, 487, 867 [NASA ADS] [CrossRef] [Google Scholar]
- Cohen, D. H., de Messières, G. E., MacFarlane, J. J., et al. 2003, ApJ, 586, 495 [NASA ADS] [CrossRef] [Google Scholar]
- Cohen, D. H., Kuhn, M. A., Gagné, M., Jensen, E. L. N., & Miller, N. A. 2008, MNRAS, 386, 1855 [NASA ADS] [CrossRef] [Google Scholar]
- Damiani, F., Maggio, A., Micela, G., & Sciortino, S. 1997a, ApJ, 483, 350 [NASA ADS] [CrossRef] [Google Scholar]
- Damiani, F., Maggio, A., Micela, G., & Sciortino, S. 1997b, ApJ, 483, 370 [NASA ADS] [CrossRef] [Google Scholar]
- Favata, F., & Micela, G. 2003, Space Sci. Rev., 108, 577 [Google Scholar]
- Feldmeier, A., Kudritzki, R.-P., Palsa, R., Pauldrach, A. W. A., & Puls, J. 1997a, A&A, 320, 899 [NASA ADS] [Google Scholar]
- Feldmeier, A., Puls, J., & Pauldrach, A. W. A. 1997b, A&A, 322, 878 [NASA ADS] [Google Scholar]
- Fossati, L., Zwintz, K., Castro, N., et al. 2014, A&A, 562, A143 [NASA ADS] [CrossRef] [EDP Sciences] [Google Scholar]
- Gagné, M., Caillault, J.-P., Stauffer, J. R., & Linsky, J. L. 1997, ApJ, 478, L87 [NASA ADS] [CrossRef] [Google Scholar]
- Gagné, M., Skinner, S. L., & Daniel, K. J. 2004, ApJ, 613, 393 [NASA ADS] [CrossRef] [Google Scholar]
- Gagné, M., Fehon, G., Savoy, M. R., et al. 2011, ApJS, 194, 5 [NASA ADS] [CrossRef] [EDP Sciences] [Google Scholar]
- Hamaguchi, K., Corcoran, M. F., & Imanishi, K. 2003, PASJ, 55, 981 [NASA ADS] [Google Scholar]
- Jardine, M., & Unruh, Y. C. 1999, A&A, 346, 883 [NASA ADS] [Google Scholar]
- Nazé, Y., Broos, P. S., Oskinova, L., et al. 2011, ApJS, 194, 7 [NASA ADS] [CrossRef] [Google Scholar]
- Nazé, Y., Oskinova, L. M., & Gosset, E. 2013, ApJ, 763, 143 [NASA ADS] [CrossRef] [Google Scholar]
- Owocki, S. P., Castor, J. I., & Rybicki, G. B. 1988, ApJ, 335, 914 [NASA ADS] [CrossRef] [Google Scholar]
- Pizzolato, N., Maggio, A., Micela, G., Sciortino, S., & Ventura, P. 2003, A&A, 397, 147 [NASA ADS] [CrossRef] [EDP Sciences] [Google Scholar]
- Rauw, G., Naze, Y., Wright, N. J., et al. 2014, ApJS, accepted [arXiv:1401.8098] [Google Scholar]
- Skinner, S. L., Sokal, K. R., Cohen, D. H., et al. 2008, ApJ, 683, 796 [NASA ADS] [CrossRef] [Google Scholar]
- Stelzer, B., Flaccomio, E., Montmerle, T., et al. 2005, ApJS, 160, 557 [NASA ADS] [CrossRef] [Google Scholar]
- Stevens, I. R., Blondin, J. M., & Pollock, A. M. T. 1992, ApJ, 386, 265 [NASA ADS] [CrossRef] [Google Scholar]
- ud-Doula, A., & Owocki, S. P. 2002, ApJ, 576, 413 [NASA ADS] [CrossRef] [Google Scholar]
- van Leeuwen, F. 2007, A&A, 474, 653 [NASA ADS] [CrossRef] [EDP Sciences] [Google Scholar]
- Walder, R., Folini, D., & Meynet, G. 2012, Space Sci. Rev., 166, 145 [NASA ADS] [CrossRef] [Google Scholar]
- Wilking, B. A., Gagné, M., & Allen, L. E. 2008, in Star Formation in the ρ Ophiuchi Molecular Cloud (Bo Reipurth), 351 [Google Scholar]
- Wolk, S. J., Broos, P. S., Getman, K. V., et al. 2011, ApJS, 194, 12 [NASA ADS] [CrossRef] [Google Scholar]
All Tables
Optical positions of the components of the ρ OphiuchiA+B system and of the X-ray centroid.
Parameters of the best fit models to the pn spectra in the three different temporal phases.
All Figures
|
Fig. 1 pn light curve of ρ Ophiuchi in broadband (0.3−8 keV), hard band (blue, >1 keV), soft band (red, <1.0 keV), and background. The events are extracted from a circular region centered on the X-ray centroid position (see Table 1) and of radius 16″. We observe three phases in ρ Ophiuchi curve: a low rate phase (0−30 ks), a rise phase (30−40 ks), and a high rate phase (>40 ks). The rate in the quiescent phase has a median value of ~182 ct/ks with a mean absolute deviation (MAD, marked by the red shaded area) of 15 ct/ks. High phase rate has a median rate of 280 ct/ks with MAD = 27 ct/ks (blue shaded area). The change in the rate is mostly seen above 1 keV, while the soft-band rate remains almost constant. |
| In the text | |
|
Fig. 2 Mos 1 image and positions of the two components of ρ Ophiuchi system, A and B. The original image is binned in blocks of size 0.2″ × 0.2″, and smoothed with a Gaussian kernel of 3 pixels. The color scale is linear. The cross marks the position of the X-ray centroid and gives a visual estimate of the positional uncertainty. The circles have radii of 1″ to account for the precision of the optical positions. Although we cannot separate X-ray emission of both components, the centroid of the emission appears closer to the A component. |
| In the text | |
|
Fig. 3 Top figure: EPIC MOS 1 (black), MOS 2 (red), and pn (green) spectra of ρ Ophiuchi during the high rate phase (top panel) and χ2 terms (bottom panel). The APEC components are plotted with dotted lines. A high temperature of ~3 keV is detected during the rise and the high rate phase. Bottom figure: same plot for HIP 100751. We note the harder spectrum of ρ Ophiuchi compared to HIP 100751. The spectra are accumulated from the same events selected for the light curve (see Fig. 1). |
| In the text | |
Current usage metrics show cumulative count of Article Views (full-text article views including HTML views, PDF and ePub downloads, according to the available data) and Abstracts Views on Vision4Press platform.
Data correspond to usage on the plateform after 2015. The current usage metrics is available 48-96 hours after online publication and is updated daily on week days.
Initial download of the metrics may take a while.