Fig. 2
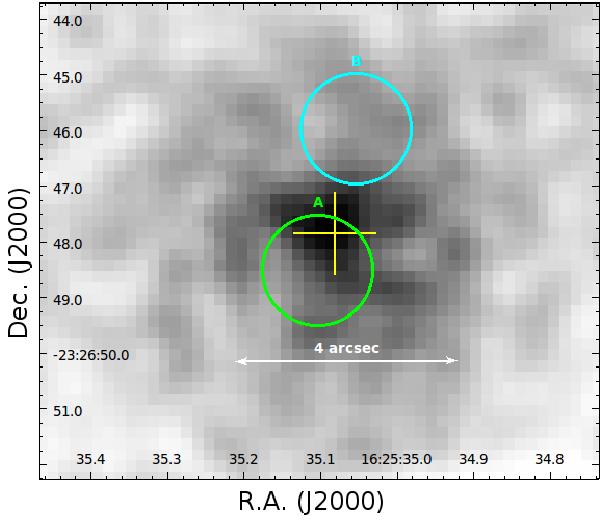
Mos 1 image and positions of the two components of ρ Ophiuchi system, A and B. The original image is binned in blocks of size 0.2″ × 0.2″, and smoothed with a Gaussian kernel of 3 pixels. The color scale is linear. The cross marks the position of the X-ray centroid and gives a visual estimate of the positional uncertainty. The circles have radii of 1″ to account for the precision of the optical positions. Although we cannot separate X-ray emission of both components, the centroid of the emission appears closer to the A component.
Current usage metrics show cumulative count of Article Views (full-text article views including HTML views, PDF and ePub downloads, according to the available data) and Abstracts Views on Vision4Press platform.
Data correspond to usage on the plateform after 2015. The current usage metrics is available 48-96 hours after online publication and is updated daily on week days.
Initial download of the metrics may take a while.