Fig. 3
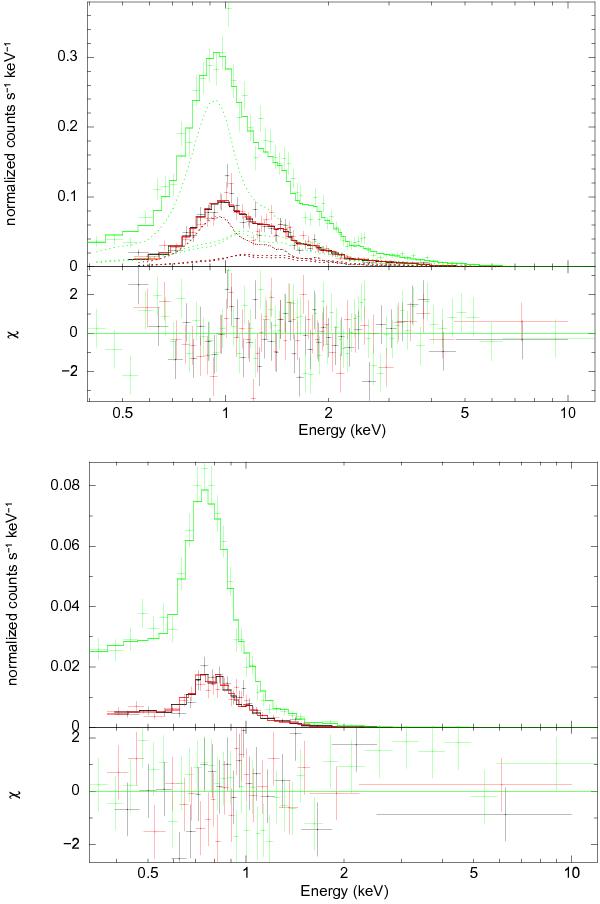
Top figure: EPIC MOS 1 (black), MOS 2 (red), and pn (green) spectra of ρ Ophiuchi during the high rate phase (top panel) and χ2 terms (bottom panel). The APEC components are plotted with dotted lines. A high temperature of ~3 keV is detected during the rise and the high rate phase. Bottom figure: same plot for HIP 100751. We note the harder spectrum of ρ Ophiuchi compared to HIP 100751. The spectra are accumulated from the same events selected for the light curve (see Fig. 1).
Current usage metrics show cumulative count of Article Views (full-text article views including HTML views, PDF and ePub downloads, according to the available data) and Abstracts Views on Vision4Press platform.
Data correspond to usage on the plateform after 2015. The current usage metrics is available 48-96 hours after online publication and is updated daily on week days.
Initial download of the metrics may take a while.