Fig. 8
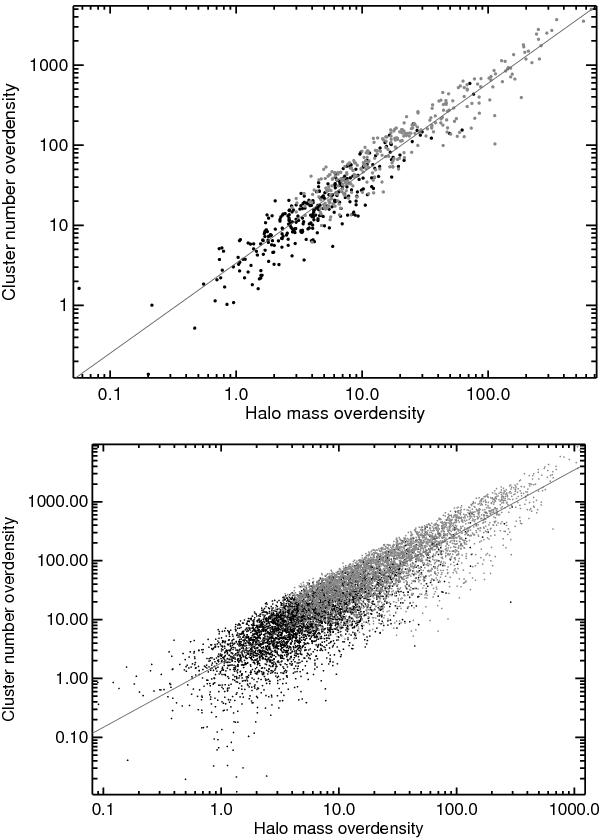
Cluster number overdensity, ΔN, as a function of the halo mass overdensity, ΔM, for pair (grey dots) and richer superclusters (black dots). The best-fit model (solid line) is shown for the CS (upper panel) and the GCS (lower panel). The fitted slope and amplitude for different mass limits for the cluster catalogues are shown in Fig. 9.
Current usage metrics show cumulative count of Article Views (full-text article views including HTML views, PDF and ePub downloads, according to the available data) and Abstracts Views on Vision4Press platform.
Data correspond to usage on the plateform after 2015. The current usage metrics is available 48-96 hours after online publication and is updated daily on week days.
Initial download of the metrics may take a while.