Fig. 7
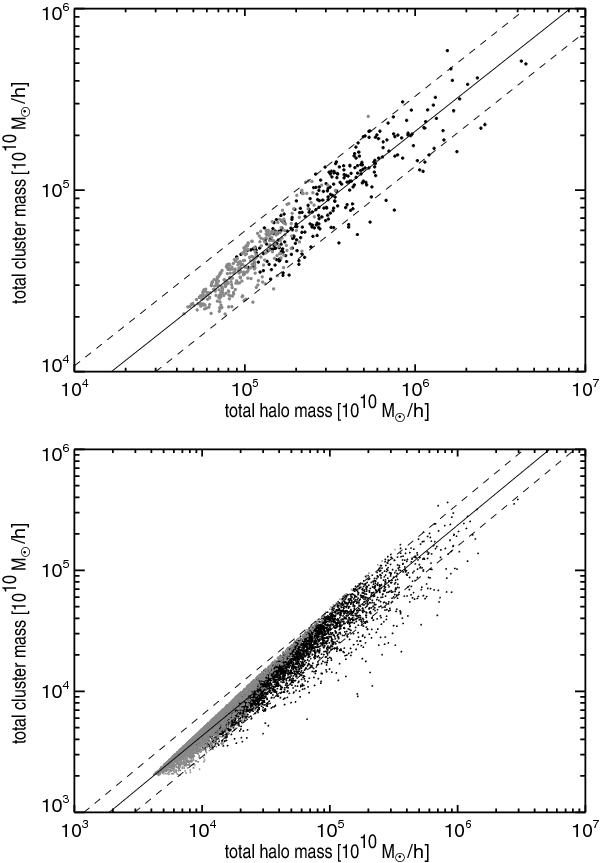
Total mass of a supercluster probed by the total mass of member clusters. The sum of the member cluster masses (CM) is plotted as a function of the true supercluster mass, i.e. the total halo masses (HM) with the correction factor applied (see text for details). The superclusters in the CS catalogue are shown in the upper panel, those in the GCS in the lower one. We show a power-law fit as a solid line with 2σ scatter of data points as dashed lines.
Current usage metrics show cumulative count of Article Views (full-text article views including HTML views, PDF and ePub downloads, according to the available data) and Abstracts Views on Vision4Press platform.
Data correspond to usage on the plateform after 2015. The current usage metrics is available 48-96 hours after online publication and is updated daily on week days.
Initial download of the metrics may take a while.