Free Access
Fig. 3
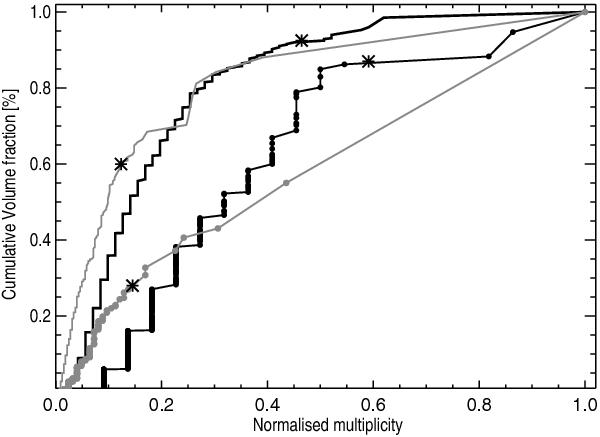
Cumulative volume fraction of superclusters as a function of normalised multiplicity. The CS is shown as filled circles, GCS as continuous lines. For the same mass limit the catalogues built with f = 2 are shown in grey, and f = 10 in black. Four asterisks mark the estimated starting scale of the percolation.
Current usage metrics show cumulative count of Article Views (full-text article views including HTML views, PDF and ePub downloads, according to the available data) and Abstracts Views on Vision4Press platform.
Data correspond to usage on the plateform after 2015. The current usage metrics is available 48-96 hours after online publication and is updated daily on week days.
Initial download of the metrics may take a while.