Free Access
Fig. 2
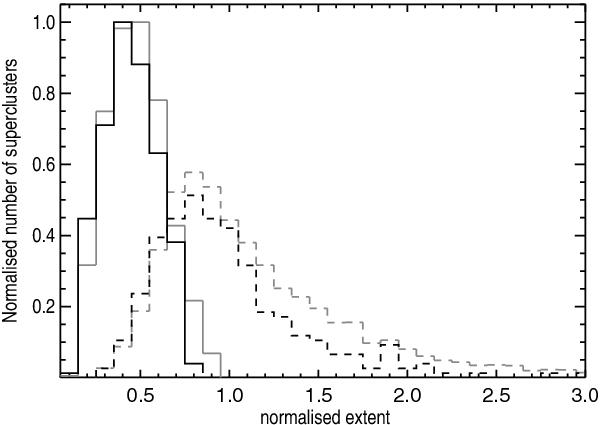
Distribution of the normalised extent of the superclusters. The superclusters in the CS are shown in black, those in the GCS in grey. Superclusters with three or more member clusters are marked by a dashed line, pair superclusters by a solid line.
Current usage metrics show cumulative count of Article Views (full-text article views including HTML views, PDF and ePub downloads, according to the available data) and Abstracts Views on Vision4Press platform.
Data correspond to usage on the plateform after 2015. The current usage metrics is available 48-96 hours after online publication and is updated daily on week days.
Initial download of the metrics may take a while.