| Issue |
A&A
Volume 567, July 2014
|
|
|---|---|---|
| Article Number | A63 | |
| Number of page(s) | 7 | |
| Section | Stellar structure and evolution | |
| DOI | https://doi.org/10.1051/0004-6361/201423845 | |
| Published online | 10 July 2014 | |
Effect of rotational mixing and metallicity on the hot star wind mass-loss rates⋆
1
Ústav teoretické fyziky a astrofyziky, Masarykova univerzita, Kotlářská
2,
611 37
Brno,
Czech Republic
2
Astronomický ústav, Akademie věd České republiky,
251 65
Ondřejov, Czech
Republic
Received:
19
March
2014
Accepted:
26
May
2014
Abstract
Hot star wind mass-loss rates depend on the abundance of individual elements. This dependence is usually accounted for assuming scaled solar chemical composition. However, this approach may not be justified in evolved rotating stars. The rotational mixing brings CNO-processed material to the stellar surface, increasing the abundance of nitrogen at the expense of carbon and oxygen, which potentially influences the mass-loss rates. We study the influence of the modified chemical composition resulting from the rotational mixing on the wind parameters, particularly the wind mass-loss rates. We use our non-local thermodynamic equilibrium wind code to predict the wind structure and compare the calculated wind mass-loss rate for the case of scaled solar chemical composition and the composition affected by the CNO cycle. We show that for a higher mass-fraction of heavier elements Z/Z⊙ ≳ 0.1 the change of chemical composition from the scaled solar to the CNO-processed scaled solar composition does not significantly affect the wind mass-loss rates. The missing line force caused by carbon and oxygen is compensated for by nitrogen line force. However, for a very low-mass fraction of heavier elements Z/Z⊙ ≲ 0.1 the rotational mixing significantly affects the wind mass-loss rates. Moreover, the decrease of the mass-loss rate with metallicity is stronger at such low metallicities. We study the relevance of the wind momentum–luminosity relationship for different metallicities and show that for a metallicity Z/Z⊙ ≲ 0.1 the relationship displays a large scatter, which depreciates the use of this relationship at the lowest metallicities.
Key words: stars: winds, outflows / stars: mass-loss / stars: early-type / hydrodynamics / stars: atmospheres
Appendix A is available in electronic form at http://www.aanda.org
© ESO, 2014
1. Introduction
With the advent of new 8m class telescopes and space-borne instruments the attention of stellar astronomers extends from our Galaxy to galaxies in the Local Group. Such observations do not only provide population studies of stars at a comparable distance, but enable us to study the influence of another key evolutionary parameter in addition to the stellar mass, namely the different chemical composition of stars, which is usually referred to as the stellar metallicity. In the hot star domain it was possible to study stars from metallicities similar to the Galactic ones in M33 (Bianchi et al. 2004) to stars with metallicities of a fraction of a Galactic one found in the dwarf irregular galaxies of the Local Group (Tramper et al. 2011; Herrero et al. 2012).
The influence of metallicity is especially important for hot star winds, which are the key mass-loss rate mechanism in hot stars. Stellar winds of hot stars are accelerated mainly as a result of light absorption in numerous lines of heavier elements including carbon, nitrogen, oxygen, and iron (Abbott 1982). Consequently, in addition to the stellar luminosity, the metallicity is the most important parameter determining the amount of stellar mass lost per unit of time, that is, the mass-loss rate Ṁ. For example, the absence of elements heavier than helium (hereafter metals) completely inhibits any line-driven outflow in massive first stars (Krtička & Kubát 2006), while the mass-loss rate in solar-metallicity massive stars amounts typically to up to 10-6 M⊙ year-1 (e.g., Puls et al. 2008) or even more.
The effect of metallicity on the hot star wind was studied in detail for a wide range of metallicities (Vink et al. 2001; Muijres et al. 2012; Pauldrach et al. 2012), providing mass-loss rate as a function of metallicity Z. Due to the lack of suitable abundance model, most of theoretical work used the solar chemical composition with abundances multiplied by the same factor for all metals (hereafter the scaled solar chemical composition), yielding the dependence of mass-loss rate on metallicity as Ṁ ~ Z0.67 (Krtička 2006). However, there is no reason to believe that the scaled solar chemical composition is always appropriate. It may lead to wrong results, especially at low metallicities. Complex chemical evolution of galaxies can lead not only to deviations from scaled solar chemical composition, but the rotational mixing in stars may change the surface chemical composition even during their main-sequence evolution (Georgy et al. 2013).
In nonrotating main-sequence stars the diffusion processes are rather weak, and the diffusion time is too long to bring the fresh elements that are synthesized in the stellar core to the stellar surface in large amounts (for clues to additional mixing see, e.g., Bouret et al. 2013). However, in rotating stars the effects of instabilities caused by nonuniform rotation and meridional circulation may imprint the signatures of thermonuclear reactions on the surface chemical composition (Meynet & Maeder 2000). In rotating first stars, the occurrence of metals on the stellar surface as a result of mixing may trigger the line-driven outflow (Krtička & Kubát 2009). At higher initial metallicity the change of fraction of CNO elements is the most notable abundance effect of thermonuclear reactions. The typical time of individual reactions of CNO cycle is different, the reaction involving 14N being the slowest (Maeder 2009). This typically leads to the transition from the abundance with oxygen as the third most abundant element to nitrogen-rich environment. Signs of such processes were detected from spectroscopic analysis (Hunter et al. 2007; Przybilla et al. 2010).
Changes in abundances affect the radiative force. The CNO elements do not contribute to the radiative force by the same amount, and their contribution also depends on the temperature (e.g., Vink et al. 2001; Krtička & Kubát 2009). Consequently, two stars in the same evolutionary phase with the same initial chemical composition may have different wind mass-loss rates purely as a result of rotational mixing. These processes were not studied theoretically in detail. Here we provide a study of the effect of chemical composition modified by the mixing on the hot star wind mass-loss rates.
An ideal way how to account for this effect would be to calculate a wind model at each time-step of the evolutionary models with proper surface abundances (as suggested by Muijres et al. 2012). However, this would be prohibitively time consuming. Therefore, to understand the effects of mixing on the mass-loss rates, we provide wind models with scaled solar chemical composition in comparison with models calculated assuming the same chemical composition, but with CNO abundances modified as a result of the CNO cycle.
2. Wind models
We used the recent version of our non-local thermodynamic equilibrium (NLTE) wind models (Krtička & Kubát 2010) with a radiative force calculated consistently from the solution of the comoving frame (CMF) radiative transfer equation with actual opacities. Our models are able to predict wind mass-loss rates from the stellar parameters, that is, the effective temperature, mass, radius, and arbitrary chemical composition. Our mass-loss rate is just a result of model calculations, we do not use any free parameters to fix it. For the model calculation we assumed stationary and spherically symmetric wind flow.
The ionization and excitation state of the considered elements was calculated from the equations of statistical equilibrium (NLTE equations). Models of individual ions are based on the Opacity and Iron Project data (Seaton et al. 1992; Hummer et al. 1993). Part of the ionic models was adopted from the TLUSTY model stellar atmosphere input data (Lanz & Hubeny 2003, 2007). For phosphorus we employed data described by Pauldrach et al. (2001). The emergent surface flux was taken from the H-He spherically symmetric NLTE model stellar atmospheres of Kubát (2003, and references therein).
The radiative force was evaluated using radiative flux calculated with the solution method of the CMF radiative transfer equation following Mihalas et al. (1975). The corresponding line opacity data were extracted in 2002 from the VALD database (Piskunov et al. 1995; Kupka et al. 1999). To calculate the radiative force and radiative cooling and heating terms (Kubát et al. 1999) we used occupation numbers derived from the statistical equilibrium equations. The hydrodynamical equations, that is, the continuity equation, equation of motion, and the energy equation, were solved iteratively to obtain the wind density, velocity, and temperature structure. The derived mass-loss rate corresponds to the only smooth transsonic solution.
Stellar parameters of the model grid.
The grid of stellar parameters corresponds to O stars in the effective temperature range
30 000−42 500 K. The stellar
masses and radii in Table 1 were calculated using
relations of Martins et al. (2005). The solar
composition abundance ratios  for each element
(el) were taken from Asplund et al. (2009)1. For the metal-deficient composition we used the scaled solar mixture
for each element
(el) were taken from Asplund et al. (2009)1. For the metal-deficient composition we used the scaled solar mixture
 . The effect of the
CNO cycle on the surface abundance was taken into account by modifying the scaled solar
mixture in such a way that the total number density of CNO elements remained the same and
the fraction of carbon and oxygen relative to nitrogen are NC/NN =
0.033 and NO/NN =
0.1 (Maeder 2009, Table 25.3
therein). Hereafter this chemical composition is referred to as the CNO-processed scaled
solar composition (see Table A.1 for the adopted
abundances of CNO elements).
. The effect of the
CNO cycle on the surface abundance was taken into account by modifying the scaled solar
mixture in such a way that the total number density of CNO elements remained the same and
the fraction of carbon and oxygen relative to nitrogen are NC/NN =
0.033 and NO/NN =
0.1 (Maeder 2009, Table 25.3
therein). Hereafter this chemical composition is referred to as the CNO-processed scaled
solar composition (see Table A.1 for the adopted
abundances of CNO elements).
3. Influence of modified abundance caused by the CNO cycle on the mass-loss rates
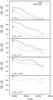 |
Fig. 1 Fraction of the line force caused by CNO elements (at the critical point) as a function of the stellar effective temperature. Individual graphs are plotted for different mass fractions of heavier elements Z/Z⊙ given in each graph. Each curve is labeled with the corresponding luminosity class. Graphs are plotted for the scaled solar chemical composition (solid lines) and for CNO-processed scaled solar chemical composition (dashed lines). |
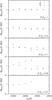 |
Fig. 2 Ratio of the mass-loss rates calculated for a CNO-processed scaled solar chemical composition and for a scaled solar chemical composition as a function of the effective temperature. Different symbols correspond to different luminosity types as indicated in the uppermost panel. |
3.1. Contribution of CNO elements to the radiative force
In Fig. 1 we plot the relative contribution of the CNO elements to the total line radiative force. These graphs (and the detailed discussion) are concerned with the radiative force at the wind critical point. The mass-loss rate is determined by conditions below this point. Basic trends in Fig. 1 can be understood by considering that the radiative force originating in optically thick lines is independent of the abundance of a given element (Puls et al. 2000; Vink et al. 2001). Many lines of CNO and heavier elements are optically thick in winds with high mass-loss rates (high densities). Heavier elements (especially iron) have effectively more optically thick lines than CNO elements, consequently, they dominate the radiative force in winds with high density. At lower wind densities (i.e. for cooler stars with higher surface gravities), the lines of less abundant elements (for example, of iron) become optically thin and do not significantly the contribute to the radiative force. On the other hand, more abundant CNO elements dominate line driving at low wind densities, because their strongest lines remain optically thick even in such conditions. Consequently, for a given metallicity the relative contribution of CNO elements to the radiative force decreases with increasing stellar luminosity and increasing effective temperature (increasing mass-loss rate). With decreasing metallicity the radiative force decreases, and therefore the mass-loss rate decreases. This leads to the increase of the relative contribution of CNO elements to the radiative force. Hence CNO lines become very important for the properties of the stellar wind in low-metallicity stars.
3.2. Influence of abundance changes of CNO on the mass-loss rates
In Fig. 2 we provide the resulting ratio of the mass-loss rate for CNO-processed scaled solar chemical composition compared with the mass-loss rate predicted for scaled solar chemical composition (see also Table A.2). This ratio is a non-trivial function of the metallicity, stellar effective temperature, and luminosity type. The complicated dependence can be understood to be the result of the varying contribution of individual CNO elements to the radiative force. The metallicity is the key parameter that determines this dependence (see Table 2).
Change of the wind mass-loss rate Ṁ for CNO-processed chemical composition.
Z = Z⊙.
In most cases, the contribution of CNO elements to the radiative force is relatively low for Z = Z⊙. Moreover, many CNO lines have such high optical depths that they are optically thick in the wind for the case of solar and CNO-processed chemical compositions, and instead of weaker optically thick CO lines for solar chemical composition, other N optically thick lines appear for the CNO-processed chemical composition. The latter effect is important especially for cooler stars from our sample. Consequently, the wind mass-loss rates for solar chemical composition and for CNO-processed chemical composition are basically the same.
Z = 0.3 Z⊙.
For giant and supergiant wind models at Z = 0.3 Z⊙ the deficiency of the radiative force caused by CO elements is compensated for by the radiative force caused by N lines for CNO-processed chemical composition. The driving by iron lines is significant as well. Consequently, the wind mass-loss rates for scaled solar chemical composition and for CNO-processed chemical composition are almost the same. For main-sequence wind models at lower effective temperatures (Teff ≤ 35 000 K, models 300-5, 325-5, and 350-5) the change to the CNO-processed chemical composition leads to a significant increase of the radiative force caused by N lines, whereas in the hotter model 375-5 this increase is not able to compensate for the decrease of the radiative force caused by the decreasing contribution by CO elements. Consequently, the main-sequence wind mass-loss rates are higher in models 300-5 and 325-5 with CNO-processed chemical composition than for the solar mixture, whereas the opposite is true for model 375-5. For Teff ≥ 40 000 K the wind enters the high mass-loss rate (high-density) regime, therefore the change of the fraction of individual CNO elements does not significantly affect the radiative force and the mass-loss rate.
Z = 0.1 Z⊙.
For model 300-1 at Z = 0.1 Z⊙ the mass-loss rate with CNO-processed chemical composition is higher by about a factor of 2 than for the scaled solar chemical composition. This is caused by a shift in ionization balance, which increases the fraction of lower ions of oxygen and also subsequently of silicon and sulfur. For Teff ≥ 37 500 K at Z = 0.01 many strong oxygen lines become optically thin for the CNO-processed chemical composition, consequently, the mass-loss rate for the scaled solar chemical composition is higher by about a factor of 2 than for the CNO-processed chemical composition. The exception is model 400-1, where the O iv lines significantly contribute to the line driving for the CNO-processed chemical composition.
Z = 0.03 Z⊙.
For giants and supergiants at Z = 0.03 Z⊙ the oxygen lines that were optically thick for the scaled solar chemical composition become optically thin for the CNO-processed chemical composition and the nitrogen lines are not able to compensate for the missing line force. For all models with Teff = 32 500 K, the ionization fraction of N iv becomes high and the line force caused by strong oxygen lines for scaled solar chemical composition is compensated for by the N iv line force. In model 300-3 all driving lines cease to be optically thick in the region of the critical point for the CNO-processed chemical composition, consequently, the mass-loss rate becomes very low. In the main-sequence model 375-5 at this metallicity the O v resonance line is optically thick. For the CNO-processed chemical composition the N v resonance doublet also becomes optically thick, leading to a significant increase of the radiative force. In models 325-5 and 350-5 this effect is weaker, because C iv and O iv also contribute to the radiative force. For the highest effective temperatures, Teff ≥ 40 000 K, the acceleration by the O v and O vi lines for the scaled solar chemical composition is not compensated for by acceleration by nitrogen for the CNO-processed chemical composition, which leads to a decrease of the mass-loss rate.
Z = 0.01 Z⊙.
For supergiant wind models at Z = 0.01 Z⊙ and Teff ≤ 35 000 K the change from the scaled solar chemical composition to the CNO-processed chemical composition does not significantly affect the line force, because instead of some oxygen lines there are new strong nitrogen lines that are able to significantly accelerate the wind. For the higher effective temperature Teff = 37 500 K and the CNO-processed chemical composition, instead of the O v lines for the scaled solar chemical composition, the N v resonance doublet becomes optically thick. This leads to an increase of the radiative force, because the N v resonance doublet is located in the spectral region with higher flux. A similar effect also occurs in model 350-3.
Cases without wind.
We were not able to converge our models for some stars with a CNO-processed chemical composition. For Z = 0.03 Z⊙ this occurred only for model 300-5, but for Z = 0.01 Z⊙ this occurred for models 300-3, 300-5, 350-5, 375-3, 375-5, and all models with Teff ≥ 40 000 K. The failed convergence indicates that there is not enough radiative force to drive a wind in this case. To verify this, we calculated additional models with a fixed hydrodynamical structure, where we compared the radiative force with the gravity (as in Krtička & Kubát 2009). These models were calculated for four different fixed mass-loss rates equal to 3Ṁ⊙, Ṁ⊙, Ṁ⊙/ 3, and 0.1Ṁ⊙, where Ṁ⊙ is the mass-loss rate for a scaled solar chemical composition and the same stellar parameters. In all these models the radiative force was significantly lower than the gravity force (see Fig. 3 for an example of such calculations for a model 300-3). This supports the conclusion that the total radiative force is not able to drive a wind and that there is no wind for a CNO-processed chemical composition in the mentioned cases.
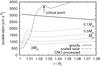 |
Fig. 3 Radial variations of the absolute values of gravitational and radiative acceleration in model 300-3 and Z = 0.01 Z⊙ (see Table A.2). The radiative acceleration for a scaled solar chemical composition is plotted as the dashed line. Since there is no wind for the CNO-processed scaled solar chemical composition, the radiative acceleration for several test models is overplotted. The test models were calculated for four different values of the mass-loss rate denoted in the graph. (Ṁ⊙ is the mass-loss rate for the scaled solar chemical composition – see text). The critical point of the 300-3 model with Z = 0.01 Z⊙ is also denoted in the graph. |
4. Metallicity variations and failure of the wind momentum–luminosity relationship for low metallicities
The mass-loss rate generally decreases with decreasing metallicity, but the rate of the
decrease is not the same for all stars, as documented in Fig. 4. We fitted the dependence of the mass-loss rate for a given star to the solar
metallicity mass-loss rate Ṁ(Z)
/Ṁ(Z⊙) by
a polynomial. An average of the logarithm of this ratio for all stars varies as
 (1)For lower
metallicities the decrease of the mass-loss rate with metallicity is steeper than for higher
metallicities (see also, e.g., Kudritzki 2002). The
metallicity variations are often expressed as Ṁ ~ Zζ,
where
(1)For lower
metallicities the decrease of the mass-loss rate with metallicity is steeper than for higher
metallicities (see also, e.g., Kudritzki 2002). The
metallicity variations are often expressed as Ṁ ~ Zζ,
where 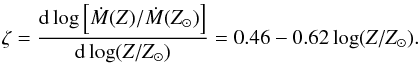 (2)The dependence of
ζ on the
metallicity is given in the lower panel of Fig. 4. For
solar metallicities, ζ ≈
0.5 and we recover the well known dependence derived, for instance, by
Puls et al. (2000). For the Small Magellanic Cloud
metallicity we derive ζ ≈
0.7, in agreement with Krtička (2006). By taking into account the range of metallicities considered by
Vink et al. (2001), we can also explain the similar
value ζ = 0.69
derived by Vink et al. (2001). The ratio of the
terminal velocity to the escape velocity varies with metallicity on average as
ν∞/ νesc
~
(Z/Z⊙)0.10,
in agreement with the results reported by Kudritzki
(2002), for example.
(2)The dependence of
ζ on the
metallicity is given in the lower panel of Fig. 4. For
solar metallicities, ζ ≈
0.5 and we recover the well known dependence derived, for instance, by
Puls et al. (2000). For the Small Magellanic Cloud
metallicity we derive ζ ≈
0.7, in agreement with Krtička (2006). By taking into account the range of metallicities considered by
Vink et al. (2001), we can also explain the similar
value ζ = 0.69
derived by Vink et al. (2001). The ratio of the
terminal velocity to the escape velocity varies with metallicity on average as
ν∞/ νesc
~
(Z/Z⊙)0.10,
in agreement with the results reported by Kudritzki
(2002), for example.
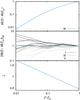 |
Fig. 4 Variation of mass-loss rate with metallicity for the scaled solar chemical composition. Upper panel: mean dependence of the ratio of the scaled solar chemical composition mass-loss rate on the solar metallicity mass-loss rate after Eq. (1). Middle panel: ratio of the mass-loss rate of individual model stars to the solar abundance mass-loss rate plotted relatively to the fit from the upper panel (Eq. (1)). Lower panel: variations of the steepness of the dependence of log [Ṁ(Z) /Ṁ(Z⊙)] on log (Z/Z⊙) (see Eq. (2)) with metallicity. |
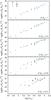 |
Fig. 5 Modified wind momentum as a function of the stellar luminosity. Different symbols correspond to different luminosity classes (full dots: supergiants, empty dots: giants, crosses: main sequence stars). Black symbols correspond to the scaled solar chemical composition and blue symbols to the CNO-processsed scaled solar chemical composition. |
The middle panel of Fig. 4 demonstrates that the mass-loss rate is not a simple function of the metallicity. Especially at Z/Z⊙ ≲ 0.1 the metallicity dependence is sensitive to the stellar parameters (as Teff, R∗, and M). This is another argument in favor of the conclusion (Muijres et al. 2012) that mass-loss rate predictions should be calculated along with evolutionary calculations for actual stellar parameters.
For a given metallicity the modified wind momentum Ṁν∞(R/R⊙)1 /2 depends mainly on the stellar luminosity (Kudritzki & Puls 2000, and references therein). With a proper metallicity calibration this relationship may be used as a distance indicator. However, from Fig. 5 it follows that the modified wind momentum uniquely depends on the stellar luminosity only for stars with higher metallicities Z/Z⊙ ≳ 0.1, whereas for stars with lower metallicities this relationship shows a relatively large scatter that makes any distance estimation problematic.
5. Conclusions
We studied the influence of the change of the chemical composition caused by the CNO cycle on the hot star wind mass-loss rates. This chemical composition evolution may result from the internal mixing caused by the rotation. The results were derived using our code, which enables calculation of a stellar wind model with arbitrary chemical composition.
For metallicities Z ≳ 0.1 Z⊙ the change from the scaled solar composition to the CNO-processed scaled solar composition does not influence the mass-loss rate significantly. There are many strong CNO lines for these metallicities, and the nitrogen lines are able to nearly completely compensate for the missing line force coming from carbon or oxygen.
However, this is not true for the lowest abundances studied here, Z ≲ 0.1 Z⊙. For these low metallicities the CNO elements significantly contribute to the radiative force. As a result of the few optically thick lines, the line force and therefore also the mass-loss rate is sensitive to the individual fraction of CNO elements. Depending on the effective temperature, the mass-loss rate may either decrease or increase when the chemical composition is changed from the scaled solar one to the composition influenced by the CNO cycle.
The dependence of the mass-loss rate on the metallicity is significantly steeper for Z ≲ 0.1 Z⊙ than for the solar abundance. Moreover, the wind mass-loss rate is very sensitive to the stellar parameters for low metallicities. As a result, the wind momentum-luminosity relationship displays a large scatter and is not unique, as it is at higher metallicities.
Online material
Appendix A: Adopted CNO abundances for the CNO-processed scaled solar chemical composition and derived results for individual models
Abundances of CNO elements for CNO-processed scaled solar composition.
Predicted wind parameters for individual stellar models.
For CNO elements  ,
,
 ,
and
,
and  .
.
Acknowledgments
This research was supported GA ČR 13-10589S. Access to computing and storage facilities owned by parties and projects contributing to the National Grid Infrastructure MetaCentrum, provided under the program “Projects of Large Infrastructure for Research, Development, and Innovations” (LM2010005), is greatly appreciated.
References
- Abbott, D. C. 1982, ApJ, 259, 282 [NASA ADS] [CrossRef] [Google Scholar]
- Asplund, M., Grevesse, N., Sauval, A. J., & Scott, P. 2009, ARA&A, 47, 481 [NASA ADS] [CrossRef] [Google Scholar]
- Bianchi, L., Bohlin, R., & Massey, P. 2004, ApJ, 601, 228 [NASA ADS] [CrossRef] [Google Scholar]
- Bouret, J.-C., Lanz, T., Martins, F., et al. 2013, A&A, 555, A1 [NASA ADS] [CrossRef] [EDP Sciences] [Google Scholar]
- Georgy, C., Ekström, S., Eggenberger, P., et al. 2013, A&A, 558, A103 [NASA ADS] [CrossRef] [EDP Sciences] [Google Scholar]
- Herrero, A., Garcia, M., Puls, J., et al. 2012, A&A, 543, A85 [NASA ADS] [CrossRef] [EDP Sciences] [Google Scholar]
- Hummer, D. G., Berrington, K. A., Eissner, W., et al. 1993, A&A, 279, 298 [NASA ADS] [Google Scholar]
- Hunter, I., Dufton, P. L., Smartt, S. J., et al. 2007, A&A, 466, 277 [NASA ADS] [CrossRef] [EDP Sciences] [Google Scholar]
- Krtička, J. 2006, MNRAS, 367, 1282 [NASA ADS] [CrossRef] [Google Scholar]
- Krtička, J., & Kubát, J. 2006, A&A, 446, 1039 [NASA ADS] [CrossRef] [EDP Sciences] [Google Scholar]
- Krtička, J., & Kubát, J. 2009, A&A, 493, 585 [NASA ADS] [CrossRef] [EDP Sciences] [Google Scholar]
- Krtička, J., & Kubát, J. 2010, A&A, 519, A5 [NASA ADS] [CrossRef] [EDP Sciences] [Google Scholar]
- Kubát J., 2003, in Modelling of Stellar Atmospheres (San Francisco: ASP), eds. N. E. Piskunov, W. W. Weiss, & D. F. Gray, IAU Symp., 210, A8 [Google Scholar]
- Kubát, J., Puls, J., & Pauldrach, A. W. A. 1999, A&A, 341, 587 [NASA ADS] [Google Scholar]
- Kudritzki, R. P. 2002, ApJ, 577, 389 [NASA ADS] [CrossRef] [Google Scholar]
- Kudritzki, R. P., & Puls, J. 2000, ARA&A, 38, 613 [NASA ADS] [CrossRef] [Google Scholar]
- Kupka, F., Piskunov, N. E., Ryabchikova, T. A., Stempels, H. C., & Weiss, W. W. 1999, A&AS, 138, 119 [NASA ADS] [CrossRef] [EDP Sciences] [MathSciNet] [PubMed] [Google Scholar]
- Lanz, T., & Hubeny, I. 2003, ApJS, 146, 417 [NASA ADS] [CrossRef] [Google Scholar]
- Lanz, T., & Hubeny, I. 2007, ApJS, 169, 83 [CrossRef] [Google Scholar]
- Lucy, L. B., & Solomon, P. M. 1970, ApJ, 159, 879 [NASA ADS] [CrossRef] [Google Scholar]
- Maeder, A. 2009, Physics, Formation and Evolution of Rotating Stars (Berlin: Springer) [Google Scholar]
- Martins, F., Schaerer, D., & Hillier, D. J. 2005, A&A, 436, 1049 [NASA ADS] [CrossRef] [EDP Sciences] [Google Scholar]
- Meynet, G., & Maeder, A. 2000, A&A, 361, 101 [NASA ADS] [Google Scholar]
- Mihalas, D., Kunasz, P. B., & Hummer, D. G. 1975, ApJ, 202, 465 [NASA ADS] [CrossRef] [Google Scholar]
- Muijres, L., Vink, J. S., de Koter, A. et al. 2012, A&A, 546, A42 [NASA ADS] [CrossRef] [EDP Sciences] [Google Scholar]
- Pauldrach, A. W. A., Hoffmann, T. L., & Lennon, M. 2001, A&A, 375, 161 [NASA ADS] [CrossRef] [EDP Sciences] [Google Scholar]
- Pauldrach, A. W. A., Vanbeveren, D., & Hoffmann, T. L. 2012, A&A, 538, A75 [NASA ADS] [CrossRef] [EDP Sciences] [Google Scholar]
- Piskunov, N. E., Kupka, F., Ryabchikova, T. A., Weiss, W. W., & Jeffery, C. S. 1995, A&AS, 112, 525 [NASA ADS] [Google Scholar]
- Przybilla, N., Firnstein, M., Nieva, M. F., et al. 2010, A&A, 517, A38 [NASA ADS] [CrossRef] [EDP Sciences] [Google Scholar]
- Puls, J., Springmann, U., & Lennon, M. 2000, A&AS, 141, 23 [NASA ADS] [CrossRef] [EDP Sciences] [Google Scholar]
- Puls, J., Vink, J. S., & Najarro, F. 2008, A&ARv, 16, 209 [NASA ADS] [CrossRef] [EDP Sciences] [Google Scholar]
- Seaton, M. J., Zeippen, C. J., Tully, J. A., et al. 1992, Rev. Mex. Astron. Astrofis., 23, 19 [NASA ADS] [EDP Sciences] [Google Scholar]
- Tramper, F., Sana, H., de Koter, A., & Kaper, L. 2011, ApJ, 741, L8 [NASA ADS] [CrossRef] [Google Scholar]
- Vink, J. S., de Koter, A., & Lamers, H. J. G. L. M. 2001, A&A, 369, 574 [NASA ADS] [CrossRef] [EDP Sciences] [Google Scholar]
All Tables
All Figures
|
Fig. 1 Fraction of the line force caused by CNO elements (at the critical point) as a function of the stellar effective temperature. Individual graphs are plotted for different mass fractions of heavier elements Z/Z⊙ given in each graph. Each curve is labeled with the corresponding luminosity class. Graphs are plotted for the scaled solar chemical composition (solid lines) and for CNO-processed scaled solar chemical composition (dashed lines). |
| In the text | |
|
Fig. 2 Ratio of the mass-loss rates calculated for a CNO-processed scaled solar chemical composition and for a scaled solar chemical composition as a function of the effective temperature. Different symbols correspond to different luminosity types as indicated in the uppermost panel. |
| In the text | |
|
Fig. 3 Radial variations of the absolute values of gravitational and radiative acceleration in model 300-3 and Z = 0.01 Z⊙ (see Table A.2). The radiative acceleration for a scaled solar chemical composition is plotted as the dashed line. Since there is no wind for the CNO-processed scaled solar chemical composition, the radiative acceleration for several test models is overplotted. The test models were calculated for four different values of the mass-loss rate denoted in the graph. (Ṁ⊙ is the mass-loss rate for the scaled solar chemical composition – see text). The critical point of the 300-3 model with Z = 0.01 Z⊙ is also denoted in the graph. |
| In the text | |
|
Fig. 4 Variation of mass-loss rate with metallicity for the scaled solar chemical composition. Upper panel: mean dependence of the ratio of the scaled solar chemical composition mass-loss rate on the solar metallicity mass-loss rate after Eq. (1). Middle panel: ratio of the mass-loss rate of individual model stars to the solar abundance mass-loss rate plotted relatively to the fit from the upper panel (Eq. (1)). Lower panel: variations of the steepness of the dependence of log [Ṁ(Z) /Ṁ(Z⊙)] on log (Z/Z⊙) (see Eq. (2)) with metallicity. |
| In the text | |
|
Fig. 5 Modified wind momentum as a function of the stellar luminosity. Different symbols correspond to different luminosity classes (full dots: supergiants, empty dots: giants, crosses: main sequence stars). Black symbols correspond to the scaled solar chemical composition and blue symbols to the CNO-processsed scaled solar chemical composition. |
| In the text | |
Current usage metrics show cumulative count of Article Views (full-text article views including HTML views, PDF and ePub downloads, according to the available data) and Abstracts Views on Vision4Press platform.
Data correspond to usage on the plateform after 2015. The current usage metrics is available 48-96 hours after online publication and is updated daily on week days.
Initial download of the metrics may take a while.