Fig. 1
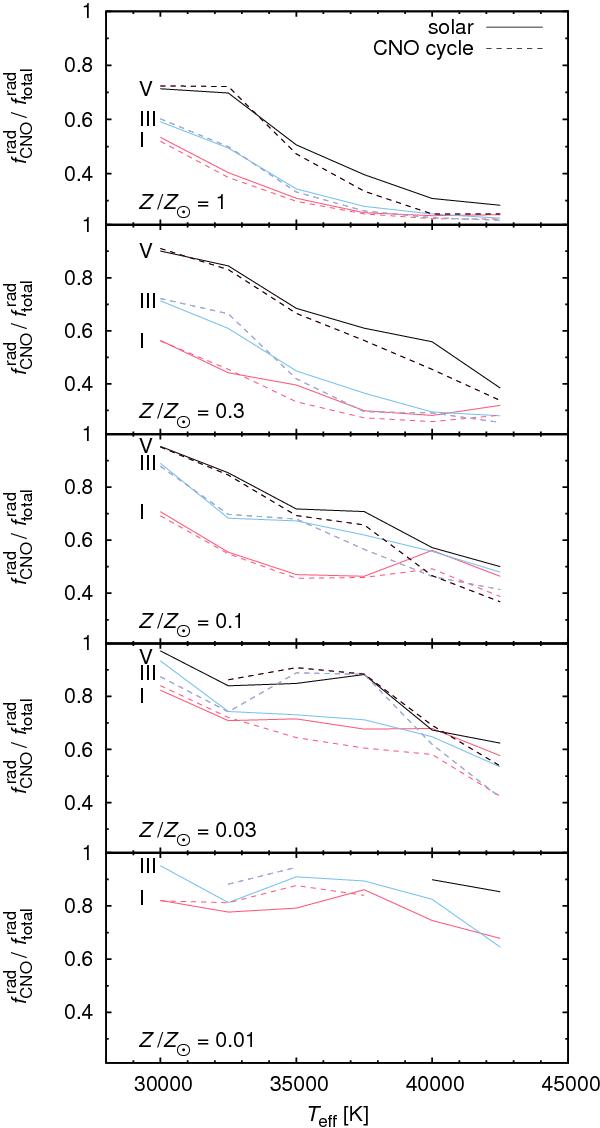
Fraction of the line force caused by CNO elements (at the critical point) as a function of the stellar effective temperature. Individual graphs are plotted for different mass fractions of heavier elements Z/Z⊙ given in each graph. Each curve is labeled with the corresponding luminosity class. Graphs are plotted for the scaled solar chemical composition (solid lines) and for CNO-processed scaled solar chemical composition (dashed lines).
Current usage metrics show cumulative count of Article Views (full-text article views including HTML views, PDF and ePub downloads, according to the available data) and Abstracts Views on Vision4Press platform.
Data correspond to usage on the plateform after 2015. The current usage metrics is available 48-96 hours after online publication and is updated daily on week days.
Initial download of the metrics may take a while.