| Issue |
A&A
Volume 566, June 2014
|
|
|---|---|---|
| Article Number | A144 | |
| Number of page(s) | 14 | |
| Section | Astrophysical processes | |
| DOI | https://doi.org/10.1051/0004-6361/201423733 | |
| Published online | 26 June 2014 | |
Ion-molecule reactions involving HCO+ and N2H+: Isotopologue equilibria from new theoretical calculations and consequences for interstellar isotope fractionation
1
Université Paris-Est, Laboratoire Modélisation et Simulation Multi Echelle,
MSME, UMR 8208 CNRS, 5 Bd
Descartes, 77454
Marne la Vallée,
France
e-mail: This email address is being protected from spambots. You need JavaScript enabled to view it.
2
LERMA and UMR 8112 du CNRS, Observatoire de Paris,
Section de Meudon, Place J.
Janssen, 92195
Meudon,
France
e-mail: This email address is being protected from spambots. You need JavaScript enabled to view it.
Received:
28
February
2014
Accepted:
14
April
2014
Abstract
Aims. We revisit with new augmented accuracy the theoretical dynamics of basic isotope exchange reactions involved in the 12C/13C, 16O/18O, and 14N/15N balance because these reactions have already been studied experimentally in great detail.
Methods. Electronic structure methods were employed to explore potential energy surfaces, full-dimensional rovibrational calculations to compute rovibrational energy levels that are numerically exact, and chemical network models to estimate the abundance ratios under interstellar conditions.
Results. New exothermicities, derived for HCO+ reacting with CO, provide rate coefficients markedly different from previous theoretical values in particular at low temperatures, resulting in new abundance ratios relevant for carbon chemistry networks. In concrete terms, we obtain a reduction in the abundance of H12C18O+ and an increase in the abundance of H13C16O+ and D13C16O+. In all studied cases, the reaction of the ion with a neutral polarizable molecule proceeds through the intermediate proton-bound complex found to be very stable. For the complexes OCH+··· CO, OCH+··· OC, COHOC+, N2··· HCO+, N2H+··· OC, and N2HN2+, we also calculated vibrational frequencies and dissociation energies.
Conclusions. The linear proton-bound complexes possess sizeable dipole moments, which may facilitate their detection.
Key words: ISM: abundances / ISM: general / ISM: molecules
© ESO, 2014
1. Introduction
Isotopic fractionation reactions have already been invoked by Watson (1976) and Dalgarno & Black
(1976) to explain the enrichment of heavy isotopes of molecules in dark cold
interstellar cloud environments. The exothermicity involved in the isotopic exchange
reaction directly depends on the difference of the zero-point energies between the two
isotopes, if one assumes that the reaction proceeds in the ground-rovibrational states of
both the reactant and product molecule. This assumption has been questioned for the reaction
H + HD⇌H2D+ + H2, where some rotational excitation in H2 may reduce the efficiency of the
reverse reaction (Pagani et al. 1992; Hugo et al. 2009).
+ HD⇌H2D+ + H2, where some rotational excitation in H2 may reduce the efficiency of the
reverse reaction (Pagani et al. 1992; Hugo et al. 2009).
In this paper we revisit some fractionation reactions involved in the 12C/13C, 16O/18O, and 14N/15N balance by reinvestigating the potential energy surfaces (PESs) involved in the isotopic exchange reactions. Within the Born-Oppenheimer approximation, a single nuclear-mass-independent PES is considered for all isotopic variants of molecules under consideration. The nuclear motions are introduced subsequently and isotopologues, molecules of different isotopic compositions and thus different masses, possess different rotational constants, different vibrational frequencies, and different ground-state (zero-point) vibrational energies, in other words, different thermodynamic properties (Urey 1947). Differences in zero-point energies can become important under cool interstellar cloud conditions where molecules rather undergo isotopic exchange (fractionation) than react chemically. This thermodynamic effect may result in isotopologue abundance ratios (significantly) deviating from the elemental isotopic ratios. Knowledge of the abundance ratios may in return provide valuable information on molecular processes at low collision energies.
As far as astrophysical models are concerned, 13C and 18O isotopic fractionation studies involving CO and HCO+ (Le Bourlot et al. 1993; Liszt 2007; Röllig & Ossenkopf 2013; Maret et al. 2013) are based on the pionneering paper by Langer et al. (1984), who referred to the experimental studies by Smith & Adams (1980) and used theoretical spectroscopic parameters for the isotopic variants of HCO+ reported by Henning et al. (1977). Lohr (1998) derived the harmonic frequencies and equilibrium rotational constants for CO, HCO+, and HOC+ at the configuration interaction (including single and double excitations) level of theory (CISD/6-31G**) and tabulated reduced partition function ratios and isotope exchange equilibrium constants for various isotope exchange reactions between CO and HCO+. Surprisingly, this paper has not received much attention in the astrophysical literature, and its conclusions have never been applied.
The studies of Langer et al. (1984) and Lohr (1998) led to qualitatively different conclusions
regarding the following fractionation reaction:  (1)which was found to be endothermic with
ΔE/kB = − 5 K by Langer et al. (1984) and exothermic with ΔE/kB =
12.5 K by Lohr (1998), where
kB
is the Boltzmann constant. To clear up this discrepancy, we carried out numerically exact
calculations for the vibrational ground state of HCO+ using a PES previously developed
by Mladenović & Schmatz (1998). Our calculations
gave ΔE/kB = 11.3 K for
reaction (1), in good agreement with the
harmonic value of Lohr (1998). In addition, we
noticed that the ΔE/kB values of Henning et al. (1977) for the reactions
(1)which was found to be endothermic with
ΔE/kB = − 5 K by Langer et al. (1984) and exothermic with ΔE/kB =
12.5 K by Lohr (1998), where
kB
is the Boltzmann constant. To clear up this discrepancy, we carried out numerically exact
calculations for the vibrational ground state of HCO+ using a PES previously developed
by Mladenović & Schmatz (1998). Our calculations
gave ΔE/kB = 11.3 K for
reaction (1), in good agreement with the
harmonic value of Lohr (1998). In addition, we
noticed that the ΔE/kB values of Henning et al. (1977) for the reactions  (2)and
  (3)were quoted as 17 ± 1 K and 7 ± 1 K by Smith & Adams (1980) and as 9 and 14 K by Langer et al. (1984). Reconsidering the original values of Henning et al. (1977), we found that Langer et al. (1984) permuted the zero-point energies for H13C16O+ and H12C18O+ in Table 2 of their paper. From
the original spectroscopic parameters of Henning et al.
(1977), we derive ΔE/kB = 10.2 K for
reaction (1), in good agreement with our
result and the result of Lohr (1998).
(3)were quoted as 17 ± 1 K and 7 ± 1 K by Smith & Adams (1980) and as 9 and 14 K by Langer et al. (1984). Reconsidering the original values of Henning et al. (1977), we found that Langer et al. (1984) permuted the zero-point energies for H13C16O+ and H12C18O+ in Table 2 of their paper. From
the original spectroscopic parameters of Henning et al.
(1977), we derive ΔE/kB = 10.2 K for
reaction (1), in good agreement with our
result and the result of Lohr (1998).
The permutation of the zero-point vibrational energies of H13C16O+ and H12C18O+ affects the exothermicities and
rate coefficients summarized in Tables 1 and 3 of the paper by Langer et al. (1984). These data are actually incorrect for all isotope
fractionation reactions CO+HCO+, except for  (4)The rate coefficients reported by Langer et al. (1984) are still widely used when including
isotopes such as 13C
and 18O into chemical
(molecular) networks (Maret et al. 2013; Röllig & Ossenkopf 2013). With these points in mind,
our goal is to provide reliable theoretical estimates for the zero-point vibrational
energies first of H/DCO+ and to derive proper rate coefficients for the related
fractionation reactions. Our improved results for the exothermicities and rate coefficients
are summarized in Tables 2 and 5.
(4)The rate coefficients reported by Langer et al. (1984) are still widely used when including
isotopes such as 13C
and 18O into chemical
(molecular) networks (Maret et al. 2013; Röllig & Ossenkopf 2013). With these points in mind,
our goal is to provide reliable theoretical estimates for the zero-point vibrational
energies first of H/DCO+ and to derive proper rate coefficients for the related
fractionation reactions. Our improved results for the exothermicities and rate coefficients
are summarized in Tables 2 and 5.
Henning et al. (1977) also reported spectroscopic parameters for various isotopic variants of N2H+. This was our initial motivation to expand the present study to ion-molecule reactions between N2H+ and N2. 15N fractionation in dense interstellar clouds has been first considered by Terzieva & Herbst (2000), who referred to the experimental information of the selected ion flow-tube (SIFT) studies at low temperatures of Adams & Smith (1981).
The reactions discussed in this paper, CO+HCO+ and N2 + HN , are the most obvious candidates for
isotopic fractionation. In addition, they have been studied in the laborataory, which allows
a detailed discussion. A similar reaction has been invoked for CN (Milam et al. 2009), but no experimental and/or theoretical information is
available there.
, are the most obvious candidates for
isotopic fractionation. In addition, they have been studied in the laborataory, which allows
a detailed discussion. A similar reaction has been invoked for CN (Milam et al. 2009), but no experimental and/or theoretical information is
available there.
In the Langevin model, the long-range contribution to the intermolecular potential is described by the isotropic interaction between the charge of the ion and the induced dipole of the neutral. Theoretical approaches based on this standard assumption may qualitatively explain the behaviour of the association rates. However, they generally provide rate coefficients that are higher than experimental results (Langer et al. 1984). The rate coefficients for ion-molecule reactions are quite constant at higher temperatures but increase rapidly at lower temperatures. The latter feature is an indication of barrierless PESs. The electrostatic forces are always attractive and can be experienced over large distances even at extremely low temperatures relevant for dark cloud enviroments. Short-range forces appear in closer encounters of interacting particles and may (prominently) influence the overall reaction rate. To explore the short-range effects we also undertake a study of linear proton-bound ionic complexes arising in the reactions involving HCO+, HOC+, and N2H+ with CO and N2, which are common interstellar species.
Our theoretical approach is described in Sect. 2. The specific aspects of the fractionation reactions of HCO+ and HOC+ with CO are reanalysed in Sect. 3.1 and the fractionation reactions N2H++N2 in Sect. 3.2. We discuss the equilibrium constants and rate coefficients of CO+HCO+/HOC+ in Sect. 4.1, providing the astrochemical implications of the new exothermicities in Sect. 4.2. The isotope fractionation reactions N2H++N2 are considered including the nuclear spin angular momentum selection rules in Sect. 4.3. The linear proton-bound cluster ions are analysed in Sect. 4.4. Our concluding remarks are given in Sect. 5.
Zero-point vibrational energies (in cm-1) of isotopologues of CO, HCO+, and HOC+.
2. Calculations
The global three-dimensional PES developed by Mladenović & Schmatz (1998) for the isomerizing system HCO+/HOC+ and by Schmatz & Mladenović (1997) for the isoelectronic species N2H+ were used in the rovibrational calculations. These two PESs still provide the most comprehensive theoretical descriptions of the spectroscopic properties for HCO+, HOC+, and N2H+ and are valid up to the first dissociation limit. Potential energy representations recently developed by Špirko et al. (2008) and by Huang et al. (2010) reproduce the experimental fundamental transitions within 11[6] and 4[3] cm-1 for N2H+[N2D+], respectively, whereas the PES of Schmatz & Mladenović (1997) predicts the fundamental transitions for both N2H+ and N2D+ within 2 cm-1.
The rovibrational energy levels of HCO+/HOC+ and N2H+ are calculated by a numerically exact quantum mechanical method, involving no dynamical approximation and applicable to any potential energy representation. The computational strategy is based on the discrete variable representation of the angular coordinate in combination with a sequential diagonalization/truncation procedure (Mladenović & Bačić 1990; Mladenović & Schmatz 1998). For both molecular systems, the rovibrational states are calculated for the total angular momentum J = 0−15. These rovibrational energies are used to evaluate theoretical partition functions and to model rate coefficients for proton transfer reactions involving HCO+ and N2H+.
To gain a first insight into dynamical features of ion-molecule reactions, additional electronic structure calculations were carried out for linear proton-bound cluster ions of HCO+, HOC+, and N2H+ with CO and N2. The PESs were scanned by means of the coupled cluster method with single and double excitations including perturbative corrections for triple excitations [CCSD(T)] in combination with the augmented correlation consistent triple ζ basis set (aug-cc-pVTZ). Only valence electrons were correlated. The ab initio calculations were carried out with the MOLPRO (Werner et al. 2012) and CFOUR (Stanton et al. 2012) quantum chemistry program packages.
3. Results
The PES of Mladenović & Schmatz (1998) provides a common potential energy representation for the formyl cation, HCO+, and the isoformyl cation, HOC+, where the local HOC+ minimum is 13 878 cm-1 (166 kJ mol-1) above the global HCO+ minimum. Inclusion of the zero-point energy reduces this separation by 640–650 cm-1 for the hydrogen-containing isotopologues and by 570–580 cm-1 for the deuterium variants. The angular motion is described by a double-minimum anharmonic potential with a non-linear saddle point at 26 838 cm-1 (321 kJ mol-1) above the HCO+ minimum, such that low-lying states of HCO+ and HOC+ are well separated.
The PES of Schmatz & Mladenović (1997) for N2H+ (dyazenilium) has two equivalent colinear minima as a consequence of the S2 permutation symmetry, separated by an isomerization barrier 17 137 cm-1 (205 kJ mol-1) above the energy of the linear geometries. Low-lying states of N2H+ are, thus, localized in one of the two wells. The double-well symmetry and nuclear spin symmetries are lifted for mixed nitrogen isotope forms.
3.1. Reaction of CO with HCO+ and HOC+
The ground-state vibrational energies calculated in this work for isotopic variants of HCO+ and HOC+ are collected in Table 1. There we additionally show the harmonic zero-point energy estimates of Lohr (1998) and the anharmonic values of Martin et al. (1993) available only for three isotopologues, as well as the values obtained by Langer et al. (1984) and in the present work from the spectroscopic [CI(corr)] parameters of Henning et al. (1977). Our values for CO are computed at the theoretical level used to construct the PES for HCO+/HOC+ [CCSD(T)/cc-pVQZ].
Zero-point energy differences (in K) between the reactants and products for the isotope fractionation reactions of H/DCO+ and H/DOC+ with CO.
The isotopologues in Table 1 are arranged in order of increasing total molecular mass. For CO and H/DOC+, the zero-point energies decrease as the total molecular mass increases, which is not the case for H/DCO+. Inspection of the table shows that the substitution of the central atom by its heavier isotope (12C→13C in H/DCO+ and 16O→18O in H/DOC+) results in a more pronounced decrease of the zero-point energy than the isotopic substitution of the terminal atom (16O→18O in H/DCO+ and 12C→13C in H/DOC+). This feature shared by H/DCO+ and H/DOC+ in Table 1 is easy to rationalize since a central atom substitution affects all three vibrational frequencies.
The zero-point energy differences for the proton transfer reactions CO+HCO+/HOC+ are listed in Table 2. The reactions involving the formyl cation are labelled with F and the reactions involving the isoformyl cation with I. The deuterium variant of reaction F1 is denoted by F1(D) and similar for all other reactions. The reactions F1, F2, F3, F4, F5, and F6 are numbered as 1004, 3408, 3407, 3457, 3406, and 3458 by Langer et al. (1984).
In Table 2, our results, the values rederived from the spectroscopic parameters of Henning et al. (column HKD77), and the harmonic values of Lohr (column L98) all agree within less than 5 K. These three data sets predict the same direction for all listed reactions, whereas Langer et al. (column LGFA84) reported reaction F6 as endothermic. The replacement of our theoretical values for CO by the experimental values taken from Huber & Herzberg (1979) affects the zero-point energy differences by at most 0.4 K.
The general trend seen in Table 2 is that 13C is preferentially placed in H/DCO+ and 18O in H/DOC+. This is in accordance with Table 1, showing a stronger decrease of the zero-point energy upon isotopic substitution of the central atom. The substitution of the two 16O by 18O or the two 12C by 13C has nearly no influence on the exothermicities, as seen by comparing ΔE for reactions F1, F1(D), I1, I1(D) with ΔE for reactions F2, F2(D), I2, I2(D) and silimar for reactions F3, F3(D), I3, I3(D) versus F4, F4(D), I4, I4(D). Slightly higher exothermicities appear for reactions involving deuterium. The exothermicities for the reactions with the isoformyl isomers are lower than for the reactions with the formyl forms.
From the measured forward reaction kf and backward reaction kr rate
coefficients, Smith & Adams (1980) calculated
the experimental zero-point energy differences using 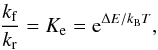 (5)where Ke is the
equilibrium constant. The total estimated error on kf and
kr is reported to be ±25% at 80 K. Table 2 indicates that the new/improved theoretical values, and the
experimental finding for reaction F1 agree within the experimental uncertainty. For
reactions F3 and F6, we see that the theoretical results consistently predict a higher
ΔE value
for H12C18O+ reacting with 13C16O (reaction F6) than for H12C16O+ reacting with 12C18O (reaction F3), whereas the
opposite was derived experimentally. Note that Smith &
Adams (1980) reported for 13C16O reacting with H12C18O+ in
addition to reaction F6 also a yield of 10% for the rearrangement channel
(5)where Ke is the
equilibrium constant. The total estimated error on kf and
kr is reported to be ±25% at 80 K. Table 2 indicates that the new/improved theoretical values, and the
experimental finding for reaction F1 agree within the experimental uncertainty. For
reactions F3 and F6, we see that the theoretical results consistently predict a higher
ΔE value
for H12C18O+ reacting with 13C16O (reaction F6) than for H12C16O+ reacting with 12C18O (reaction F3), whereas the
opposite was derived experimentally. Note that Smith &
Adams (1980) reported for 13C16O reacting with H12C18O+ in
addition to reaction F6 also a yield of 10% for the rearrangement channel  (6)The latter transformation is not of a simple
proton-transfer type (but bond-rearrangement type) and must involve a more complicated
chemical mechanism probably including an activation energy barrier.
(6)The latter transformation is not of a simple
proton-transfer type (but bond-rearrangement type) and must involve a more complicated
chemical mechanism probably including an activation energy barrier.
3.2. Reaction of N2 with N2H+
Zero-point vibrational energies (in cm-1) of isotopologues of N2 and N2H+.
Zero-point energy differences (in K) between the reactants and products for the isotope fractionation reactions of N2H+ with N2.
The zero-point vibrational energies calculated for N2H+ are summarized in Table 3. In addition to the results obtained for the PES of Schmatz & Mladenović (1997), Table 3 also provides the values we derived from the spectroscopic parameters of Huang et al. (2010, column HVL10) and of Henning et al. (1977, column HKD77). The values for N2 are taken from Huber & Herzberg (1979). The zero-point energy differences are given in Table 4. As seen there, our results agree with the values obtained from the spectroscopic parameters of Huang et al. (2010) within 0.4 K. The reactions involving diazenylium (or dinitrogen monohydride cation) are labelled with D in Table 4.
The 14N/15N substitution at the central-atom position lowers the zero-point energy more than the terminal-atom substitution (Table 3), such that 15N preferentially assumes the central position in N-N-H+ in all reactions of N2H+ with N2 in Table 4. The exothermicities are found to be slightly higher for the reactions involving deuterium.
In Table 4, the experimental (SIFT) results of
Adams & Smith (1981) are listed as given in
their paper. Note, however, that the elementary isotope fractionation reactions D2 and D3
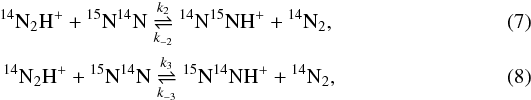 involve common reactants, whereas reactions
D4 and D5
involve common reactants, whereas reactions
D4 and D5 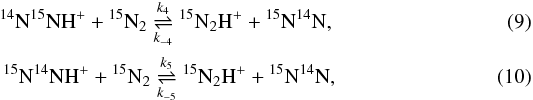 have common products. The two reaction pairs
are related by the 14N→
15N substitution. Using thermodynamic reasoning, it is
easy to verify that the following relationship
have common products. The two reaction pairs
are related by the 14N→
15N substitution. Using thermodynamic reasoning, it is
easy to verify that the following relationship 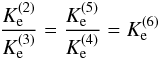 (11)is strictly fulfilled for
 , where
 corresponds to reaction D6,
 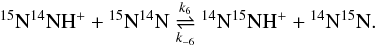 (12)Note that the factor
 also provides the thermal population of
15N14NH+ relative to 14N15NH+.
also provides the thermal population of
15N14NH+ relative to 14N15NH+.
4. Discussion
The equilibrium constant Ke for the proton transfer reaction
 (13)under thermal equilibrium conditions is given
by
(13)under thermal equilibrium conditions is given
by 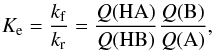 (14)where Q(X) is the
full partition function for the species X. Making the translation contribution explicit, we
obtain
(14)where Q(X) is the
full partition function for the species X. Making the translation contribution explicit, we
obtain 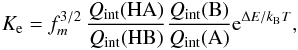 (15)where the mass factor fm is given by
 (16)for m(X) denoting the mass of the species X, whereas ΔE stands for the zero-point
energy difference between the reactants and the products,
(16)for m(X) denoting the mass of the species X, whereas ΔE stands for the zero-point
energy difference between the reactants and the products,  (17)The zero-point energies E0 are measured on
an absolute energy scale. For isotope fractionation reactions, the internal partition
function, Qint, includes only the rovibrational
degrees of freedom (no electronic contribution) and is given by the standard expression
(17)The zero-point energies E0 are measured on
an absolute energy scale. For isotope fractionation reactions, the internal partition
function, Qint, includes only the rovibrational
degrees of freedom (no electronic contribution) and is given by the standard expression
 (18)where
  for a total angular momentum J is the rovibrational energy
measured relative to the corresponding zero-point energy (J = 0). The factor
(2J + 1)
accounts for the degeneracy relative to the space-fixed reference frame and g for the nuclear spin
(hyperfine) degeneracy,
for a total angular momentum J is the rovibrational energy
measured relative to the corresponding zero-point energy (J = 0). The factor
(2J + 1)
accounts for the degeneracy relative to the space-fixed reference frame and g for the nuclear spin
(hyperfine) degeneracy,  (19)in which α labels the constituent
nuclei having the nuclear spin IN,α. For the nuclei
considered in the present work, we have IN(H)= 1/2, IN(D)= 1, IN(12C)= 0, IN(13C)= 1/2, IN(16O)= 0, IN(18O)= 0, IN(14N)= 1, and IN(15N)= 1/2.
(19)in which α labels the constituent
nuclei having the nuclear spin IN,α. For the nuclei
considered in the present work, we have IN(H)= 1/2, IN(D)= 1, IN(12C)= 0, IN(13C)= 1/2, IN(16O)= 0, IN(18O)= 0, IN(14N)= 1, and IN(15N)= 1/2.
Introducing the ratio  (20)the equilibrium constant is compactly written
as
(20)the equilibrium constant is compactly written
as  (21)where the partition function factor
Fq is
(21)where the partition function factor
Fq is  (22)For reactions proceeding in the
ground-rovibrational states of the reactants and the products, the partition function ratios
(22)For reactions proceeding in the
ground-rovibrational states of the reactants and the products, the partition function ratios
 and
and  are both equal to 1. Even then the
corresponding partition function factor Fq of Eq. (22) is, strictly speaking, different from 1
because of the mass term fm defined by Eq.
(16). For the reactions F1–F6 in Table
2, for instance, the
are both equal to 1. Even then the
corresponding partition function factor Fq of Eq. (22) is, strictly speaking, different from 1
because of the mass term fm defined by Eq.
(16). For the reactions F1–F6 in Table
2, for instance, the
 values are 0.998, 0.998, 0.997, 0.997,
0.995, and 1.002, respectively, which are different from 1 at most by 0.5%.The
values are computed from Eq. (16) using the following atomic masses
m(H) =
1.007825035, m(D) = 2.014101779, m(12C) = 12,
m(13C) =
13.003354826, m(16O) = 15.99491463, and m(18O) =
17.9991603 u, as given by Mills et al.
(1993).
values are 0.998, 0.998, 0.997, 0.997,
0.995, and 1.002, respectively, which are different from 1 at most by 0.5%.The
values are computed from Eq. (16) using the following atomic masses
m(H) =
1.007825035, m(D) = 2.014101779, m(12C) = 12,
m(13C) =
13.003354826, m(16O) = 15.99491463, and m(18O) =
17.9991603 u, as given by Mills et al.
(1993).
The terms of Qint in Eq. (18) decrease rapidly with energy and J. In the low-temperature limit relevant for dark cloud conditions, the discrete rotational structure of the ground-vibrational state provides the main contribution to Qint. That said, the rotational energy cannot be treated as continuous and one must explicitly sum the terms to obtain Qint. With increasing temperature, the rotational population in the ground-vibrational state increases and other vibrational states may also become accessible, leading to partition function factors Fq, which may show (weak) temperature dependences.
For a given PES, numerically exact full-dimensional strategies insure the determination of accurate level energies and therefore accurate partition functions and equilibrium constants. To predict/estimate rate coefficients, we may use kinetic models, such as e.g. the Langevin collision rate model for ion-molecule reactions. Uncertainties in the rate coefficients are thus defined by uncertainties in the model parameters. In the case of the system CO+HCO+, we employ the total rate coefficients from Table 3 of Langer et al. (1984) and the uncertainties of these quantities also provide the uncertainties of the rate coefficients derived in the present work.
4.1. Reaction of CO with HCO+
Equilibrium constants Ke, partition function factors Fq, and rate coefficients kf,kr (in 10-10 cm3 s-1) for the reactions of H/DCO+ with CO.
The equilibrium constants for HCO+ reacting with CO are given in Table 5. Our Ke values are obtained in accordance
with Eq. (21) by direct evaluation of the
internal partition functions Qint from the computed rovibrational
energies. The forward reaction kf and backward reaction kr rate
coefficients are calculated using our ΔE values and the total temperature-dependent rate
coefficients kT given by Langer et al. (1984), where  (23)such that
  The results for the deuterium variants are
also listed in Table 5. Their rate coefficients
kf and kr are
calculated assuming the same total rate coefficients kT as for the
H-containing forms (due to nearly equal reduced masses). For the purpose of comparison,
note that the Langevin rate for CO+HCO+ is kL = 8.67 × 10⁻¹⁰
cm3 s-1.
The results for the deuterium variants are
also listed in Table 5. Their rate coefficients
kf and kr are
calculated assuming the same total rate coefficients kT as for the
H-containing forms (due to nearly equal reduced masses). For the purpose of comparison,
note that the Langevin rate for CO+HCO+ is kL = 8.67 × 10⁻¹⁰
cm3 s-1.
The partition function factors Fq deviate from 1 by approximately 2% in Table 5. They also exhibit marginal temperature dependences. This reflects the influence of rotational and vibrational excitations in the reactants and the products. Only the rotationally excited ground-vibrational states contribute to Qint at temperatures T< 200 K. The contribution of the bending ν2 level is 0.5% at 200 K and 3.6–3.8% at 300 K, whereas the contributions from 2ν2 are 0.1% at 300 K. To appreciate the effect of Fq, we employed the rate coefficients measured at 80 K by Smith & Adams (1980) to determine the ΔE value for reactions F1, F3, and F6 by means of Eq. (21). Using the Fq values from Table 5, we obtain ΔE/kB of 13.8, 15.1, and 4.8 K, respectively. For Fq = 1, we find 12.3, 14.6, and 3.8 K, which are lower by 1.5 K (12%), 0.5 K (3%), and 1 K (26%) than the former Fq ≠ 1 results.
The equilibrium constants Ke reported by Langer et al. (1984) deviate from the present results and those of Lohr (1998) very prominently at low temperatures in Table 5. At 10 K, we see deviations of 43% and 217% with respect to our values for reactions F1 and F3, respectively, and the related rate coefficients kf,kr are accordingly different. An even larger discrepancy is seen for reaction F6 of Eq. (1), which was previously predicted to be endothermic. In accordance with this, the values of kf and kr derived by Langer et al. (1984) are given in the reverse positions as (kr,kf) for reaction F6 in Table 5.
The deuterium variants in Table 5 are associated with slightly lower Fq values and somewhat higher low-temperature Ke, resulting in somewhat faster foward reactions and slower backward reactions.
4.2. Astrochemical implications
Isotopic fractionation ratios at 10 K for three H2 densities, n(H2).
We investigated the role of these new derived exothermicities under different density
conditions relevant to cold dark interstellar clouds. We display in Table 6 steady-state results for isotopic ratios of CO,
HCO+ and
DCO+ for two
chemical models performed at a temperature of 10 K with a cosmic ionization rate
ζ of
1.3 × 10⁻¹⁷
s-1 per
H2 molecule with
the old ΔE
values by Langer et al. (Model A: LGFA84) and the present ΔE values listed in Table
2 (Model B). The ratios of the principal isotope
to the minor isotope obtained for Model A, RA, and for Model B, RB, are compared
using the relative difference δ,
 (26)The chemical network contains 288 chemical
species including 13C and 18O containing molecules as well as deuterated species
and more than 5000 reactions. We assumed that the elemental 12C/13C and 16O/18O isotopic ratios are 60 and
500, so that any deviation relative to these values measures the amount of
enrichment/depletion with respect to the elemental ratios. For the 13C18O-containing molecules the
value of 30 000 is the reference. The zero-point energies of other isotopic substitutes do
not pose any problem because the reactions involved in the interstellar chemical networks
are significantly exothermic and the solutions of the chemical equations are independent
of these quantities.
(26)The chemical network contains 288 chemical
species including 13C and 18O containing molecules as well as deuterated species
and more than 5000 reactions. We assumed that the elemental 12C/13C and 16O/18O isotopic ratios are 60 and
500, so that any deviation relative to these values measures the amount of
enrichment/depletion with respect to the elemental ratios. For the 13C18O-containing molecules the
value of 30 000 is the reference. The zero-point energies of other isotopic substitutes do
not pose any problem because the reactions involved in the interstellar chemical networks
are significantly exothermic and the solutions of the chemical equations are independent
of these quantities.
The isotopic fractionation reactions are introduced explicitly in the chemical network,
whereas the other reactions involving isotopologues are built automatically from the
reactions involving the main isotope in the chemical code. The adopted method has first
been presented in Le Bourlot et al. (1993), where
statistical arguments were used to derive the various branching ratios in the chemical
reactions. The procedure is limited to three carbon-containing molecules
(oxygen-containing molecules have a maximum of two oxygen atoms in our chemical network)
and does not disitinguish between C13CC- or 13CCC-containing species. A similar approach has recently
been applied by Röllig & Ossenkopf (2013) for
photon-dominated region models. However, Röllig &
Ossenkopf (2013) used the old (LGFA84) exothermicity values. We also explicitly
introduce the relation given by Langer et al.
(1984) that kf + kr =
kT. The forward reaction kf and reverse
reaction kr rate coefficients involved in the
isotopic exchange reaction are then evaluated from the total rate coefficient
kT as follows  (27)and
  (28)These expressions have also been included in
the study of fractionation in diffuse clouds presented by Liszt (2007).
(28)These expressions have also been included in
the study of fractionation in diffuse clouds presented by Liszt (2007).
The results summarized in Table 6 show that CO/13CO has the elemental value, whereas rarer isotopologues are very slightly depleted. The results for Models A and B are also very similar because no differences were used for the reaction rate coefficients between 13C+ and CO. However, more significant are the differences for the results for the isotopic ratio of HCO+, which directly arise from the variations of the exothermicities found in the present work. We also introduced a fractionation reaction for the deuterated isotope, whose rotational frequencies have been measured in the laboratory (Caselli & Dore 2005) and are detected in the interstellar medium (Guelin et al. 1982; Caselli et al. 2002). As the exothermicity of the deuterated isotopologues is somewhat higher, the isotopic 13C ratio is somewhat lower than in the hydrogenic counterpart.
The general trend seen in Table 6 is that the new Model B predicts lower fractional abundances x for H12C16O+ (up to 2%) and D12C16O+ (up to 5%), lower relative abundances RB of H12C18O+ (7–21%), and higher relative abundances of the 13C-containing isotopologues (up to 40% for the hydrogenic forms and up to 75% for the deuterated forms) than Model A.
4.3. Reaction of N2 with N2H+
Molecular nitrogen is a homonuclear diatomic molecule with a
X ground-electronic state with the three
naturally occurring isotopologues: 14N2, 14N15N, and 15N2. Whereas 14N is a spin-1 boson, 15N is a spin-1/2 fermion, such
that the two symmetric forms 14N2 and 15N2 follow different nuclear spin statistics. In the states
with a higher nuclear spin degeneracy (ortho states), we have g = (IN +
1)(2IN + 1), whereas g =
IN(2IN + 1)
holds for the states with lower nuclear spin degeneracy (para states). To properly account
for this effect, we evaluated the internal partition functions separately for even and odd
J values,
ground-electronic state with the three
naturally occurring isotopologues: 14N2, 14N15N, and 15N2. Whereas 14N is a spin-1 boson, 15N is a spin-1/2 fermion, such
that the two symmetric forms 14N2 and 15N2 follow different nuclear spin statistics. In the states
with a higher nuclear spin degeneracy (ortho states), we have g = (IN +
1)(2IN + 1), whereas g =
IN(2IN + 1)
holds for the states with lower nuclear spin degeneracy (para states). To properly account
for this effect, we evaluated the internal partition functions separately for even and odd
J values,
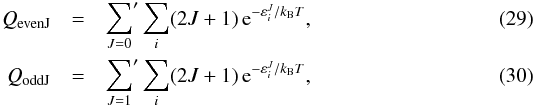 where Σ′ denotes summation in steps of 2.
Multiplying each term by the appropriate nuclear spin (hyperfine) degeneracy factor, we
obtain the partition function for N2 as
where Σ′ denotes summation in steps of 2.
Multiplying each term by the appropriate nuclear spin (hyperfine) degeneracy factor, we
obtain the partition function for N2 as  14N15N is not a homonuclear diatomic molecule, such that
 (33)The equilibrium constants Ke and rate
coefficients for the isotopic variants of N2H+ reacting with N2 are shown in Table 7. There we assumed the total rate coefficient kT given by the
Langevin collision rate (in SI units)
(33)The equilibrium constants Ke and rate
coefficients for the isotopic variants of N2H+ reacting with N2 are shown in Table 7. There we assumed the total rate coefficient kT given by the
Langevin collision rate (in SI units)  (34)where e is the elementary charge,
μR the reduced mass for the collision, and
α(N2) the polarizability of
N2
(α(N2) =
1.710 Å3, Olney et al.
1997), giving thus kT = kL = 8.11 ×
10-10 cm3 s-1. The rate coefficients kf and
kr are determined from kT and
Ke with the help of Eqs. (24) and (25), respectively. Spectroscopic parameters of Trickl et al. (1995) and Bendtsen
(2001) were used for the
(34)where e is the elementary charge,
μR the reduced mass for the collision, and
α(N2) the polarizability of
N2
(α(N2) =
1.710 Å3, Olney et al.
1997), giving thus kT = kL = 8.11 ×
10-10 cm3 s-1. The rate coefficients kf and
kr are determined from kT and
Ke with the help of Eqs. (24) and (25), respectively. Spectroscopic parameters of Trickl et al. (1995) and Bendtsen
(2001) were used for the  states of 14N2, 14N15N, and 15N2.
Equilibrium constants Ke, partition function factors Fq, and rate coefficients kf,kr (in 10-10 cm3 s-1) for the reactions of N2H+ with N2.
The nuclear spin degeneracy affects the equilibrium constants for the reactions involving
either 14N2 or 15N2. At higher temperatures, Ke in Table
7 approaches 1/2 for reactions D2 and D3 having
 as a product, and 2 for reactions D4 and
D5 having
as a product, and 2 for reactions D4 and
D5 having  as a reactant. For reaction D1,
 (35)the effects from nuclear spin statistics
cancel out and
(35)the effects from nuclear spin statistics
cancel out and  as the temperature increases. From Eqs.
(31) and (32), the ortho-to-para ratio is given by R14 =
6QevenJ/
3QoddJ for 14N2 and by R15 =
3QoddJ/QevenJ
for 15N2. We may note that R14 assumes a
value of 2.41 (2.01) and R15 a value of 2.60 (2.99) at 5 K (10
K). At high temperature equilibrium, we have R14 = 2 and R15 = 3.
as the temperature increases. From Eqs.
(31) and (32), the ortho-to-para ratio is given by R14 =
6QevenJ/
3QoddJ for 14N2 and by R15 =
3QoddJ/QevenJ
for 15N2. We may note that R14 assumes a
value of 2.41 (2.01) and R15 a value of 2.60 (2.99) at 5 K (10
K). At high temperature equilibrium, we have R14 = 2 and R15 = 3.
Adams & Smith (1981) employed normal nitrogen (ratio 2:1 of ortho vs. para 14N2) in the SIFT experimental study of N2H++N2. To measure the forward reaction and backward reaction rate coefficients at a given temperature, they interchanged the ion-source gas and reactant gas. Using mass-selected samples, these authors, however, were unable to distinguish between the isotopomers 14N15NH+ and 15N14NH+, such that their results provide the overall yield of these cations (no information on the relative yields). This applies to the competing reactions D2 and D3 on one side and the competing reactions D4 and D5 on the other side. 14N15NH+ and 15N14NH+ are expected to be differently fractionated (see Table 4).
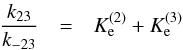
To simulate the experimental conditions of Adams &
Smith (1981), we introduced the overall forward k23 and overall
reverse k-23 rate coefficients for reactions D2
and D3, ![Mathematical equation: \begin{eqnarray} \label{rate_23_f} &k_{23} = k_2 + k_3, \\ \label{rate_23_r} &k_{-23} = \left[ k_{-2} {K_{\rm e}^{(6)}} + k_{-3} \right] \frac{1}{1+K_{\rm e}^{(6)}}, \end{eqnarray}](/articles/aa/full_html/2014/06/aa23733-14/aa23733-14-eq171.png) and the overall forward k45 and overall
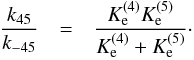
reverse k-45 rate coefficients for reactions D4
and D5,
and the overall forward k45 and overall
reverse k-45 rate coefficients for reactions D4
and D5, ![Mathematical equation: \begin{eqnarray} \label{rate_45_r} &k_{-45} = k_{-4} + k_{-5},\\ \label{rate_45_f} &k_{45} = \left[ k_4 K_{\rm e}^{(6)} + k_5 \right] \frac{1}{1 + K_{\rm e}^{(6)}} \cdot \end{eqnarray}](/articles/aa/full_html/2014/06/aa23733-14/aa23733-14-eq174.png) Here we explicitly assumed an equilibrium
distribution between 14N15NH+ and 15N14NH+. The term
Here we explicitly assumed an equilibrium
distribution between 14N15NH+ and 15N14NH+. The term  is the state-distribution normalization
factor.
is the state-distribution normalization
factor.
The variation of the rate coefficients with the temperature is displayed in Fig. 1. The common feature seen there is that the forward reaction becomes faster and the backward reaction slower with decreasing temperature. We also see that kf and kr exhibit a very weak temperature dependence for T> 50 K. For reactions D1 and D6, kf and kr approach the same value (kL/ 2 in our model) at higher temperatures in Fig. 1a and Table 7. The high temperature limits of ki and k−i for i = 2−5 are, however, different because of the nuclear spin restrictions, as clearly seen in Figs. 1b,c. The reverse rate coefficients k-2 and k-3 in Fig. 1b become even higher than k2 and k3 for T> 14.7 K and T> 3.4 K, respectively, inverting thus the reaction direction. Herbst (2003) also found k-3>k3 at T = 10 K for reaction D3 assuming a different rate-coefficient model.
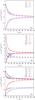 |
Fig. 1 Temperature dependence of the rate coefficients for N2H+ + N2 for reactions D1 and D6 in a), reactions D2 and D3 in b), and reactions D4 and D5 in c). |
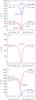 |
Fig. 2 Minimum energy paths for the linear approach of CO to HCO+/HOC+ in a), for
the linear approach of N2 to HN |
For the overall state-averaged rate coefficients in Fig. 1 and Table 7, we have k23>k-23
and k45>k-45
for all temperatures shown. This is in accordance with the SIFT experiment of Adams & Smith (1981). The rate coefficients
k±23 and k± 45 appear 30% higher than the
experimental finding, reported with an error of ±25% at 80 K. Note, however, that the ratios k23/k-23 and
k45/k-45
agree within 6% with the corresponding experimental values. Due to the nuclear spin
angular momentum selection rules, the high-temperature limits (for
 ) of k± 23 and
k±45 are different from the high-temperature limits of
k±1 and k± 6.
) of k± 23 and
k±45 are different from the high-temperature limits of
k±1 and k± 6.
From Eqs. (36)–(39) and the relationship of Eq. (11), we easily obtain
 (40)and
 (41)Following the procedure of Adams & Smith (1981), we may model the temperature
dependence of the latter ratios as e
ΔEij/kBT
(compare with Eq. (5)).
Using our results from Table 7 for the overall
forward and overall reverse rate coefficients calculated at the temperatures of the SIFT
experimental study, T =
80 K and T
= 292 K, we derive ΔE23,ΔE45 =
6.5 K for both reaction pairs.
(41)Following the procedure of Adams & Smith (1981), we may model the temperature
dependence of the latter ratios as e
ΔEij/kBT
(compare with Eq. (5)).
Using our results from Table 7 for the overall
forward and overall reverse rate coefficients calculated at the temperatures of the SIFT
experimental study, T =
80 K and T
= 292 K, we derive ΔE23,ΔE45 =
6.5 K for both reaction pairs.
Adams & Smith (1981) estimated the zero-point energy difference of 9 ± 3 K for reactions D2 and D4 (see Table 4). In accordance with the analysis presented here, we see, however, that the results of Adams & Smith (1981) should be attributed to the reaction pairs {D2, D3} and {D4, D5}. This also explains a large discrepancy seen in Table 4 between the theoretical estimates and experimental finding for reaction D4.
In recent studies of Bizzocchi et al. (2010, 2013), 14N15NH+ and 15N14NH+ were both detected in a prototypical starless core
L1544 of low central temperature and an abundance ratio
![Mathematical equation: \hbox{$R^{14,15}_{15,14}=[{^{14}\mathrm{N}}{^{15}\mathrm{N}}\mathrm{H}^+]/[{^{15}\mathrm{N}}{^{14}\mathrm{N}}\mathrm{H}^+]$}](/articles/aa/full_html/2014/06/aa23733-14/aa23733-14-eq212.png) of 1.1 ± 0.3 was derived. Note that the ratio
of 1.1 ± 0.3 was derived. Note that the ratio
 correlates with
 describing reaction D6 of Eq. (12). As seen in Table 7, we obtain of 1.22–1.02 for T = 40−292 K; the
additional calculation at T =
30 K gave
describing reaction D6 of Eq. (12). As seen in Table 7, we obtain of 1.22–1.02 for T = 40−292 K; the
additional calculation at T =
30 K gave  . Also note that the earlier model of Rodgers & Charnley (2004) has led to the ratio
of 1.8–2.3, which correlates with our
value of 2.27 (1.72) at T = 10 K (15 K).
. Also note that the earlier model of Rodgers & Charnley (2004) has led to the ratio
of 1.8–2.3, which correlates with our
value of 2.27 (1.72) at T = 10 K (15 K).
4.4. Ionic complexes
Ion-molecule reactions were additionally examined using electronic structure calculations, carried out for the linear approach of the neutral CO and N2 to the linear cations HCO+, HOC+, and N2H+. The corresponding minimum-energy paths (MEPs) are displayed in Fig. 2. The MEPs are obtained optimizing three intramolecular distances for various monomer separations. Our calculations were performed at the CCSD(T)/aug-cc-pVTZ level of theory employing the standard MOLPRO and CFOUR optimization/threshold parameters.
The lower MEP in Fig. 2c is related to the reaction
 (42)which is considered to be the main
destruction path for N2H+ when CO is present in the gas phase at standard
abundances [CO]/[H2] ~
10-4 (Snyder et al.
1977; Jørgensen et al. 2004). For this
reaction, Herbst et al. (1975) reported a rate
coefficient of 8.79 ×
10-10 cm3 s-1 at 297 ± 2 K. No reverse reaction was detected (Anicich 1993). For reactions involving HOC+, Freeman et al. (1987) measured a rate coefficient k of 6.70 × 10⁻¹⁰ cm3 s-1 for the following reaction
(42)which is considered to be the main
destruction path for N2H+ when CO is present in the gas phase at standard
abundances [CO]/[H2] ~
10-4 (Snyder et al.
1977; Jørgensen et al. 2004). For this
reaction, Herbst et al. (1975) reported a rate
coefficient of 8.79 ×
10-10 cm3 s-1 at 297 ± 2 K. No reverse reaction was detected (Anicich 1993). For reactions involving HOC+, Freeman et al. (1987) measured a rate coefficient k of 6.70 × 10⁻¹⁰ cm3 s-1 for the following reaction
 (43)whereas Wagner-Redeker et al. (1985) reported k as 6.70 × 10⁻¹⁰ cm3 s-1 for
  (44)The Langevin collision rate is
kL = 8.67 ×
10-10 cm3 s-1 for reactions (42) and (43) involving
CO and kL = 8.11 ×
10-10 cm3 s-1 for reaction (44) involving N2.
(44)The Langevin collision rate is
kL = 8.67 ×
10-10 cm3 s-1 for reactions (42) and (43) involving
CO and kL = 8.11 ×
10-10 cm3 s-1 for reaction (44) involving N2.
The common feature in Fig. 2 is the formation of a linear proton-bound ionic complex, which is 2000–7000 cm-1 more stable than the separated monomers. The properties of the complexes are summarized in Table 8, where we give the geometric parameters ri, the equilibrium rotational constants Be, the harmonic wavenumbers ωi for the main and deuterated isotopologues, and the harmonic zero-point energies E0. The corresponding results for the constituent monomers are listed in Table 9. Note that the monomer values E0 in Table 9 are harmonic and therefore different from the anharmonic results of Table 1. The coordinates ri(i = 1−4) for A–B–H–C–D denote r1 = r(A− B),r2 = r(B− H),r3 = r(H−C) and r4 = r(C − D) in Table 8 and similar in Table 9. The dipole moments μz and the quadrupole moments Θzz in Table 8 and 9 are given with respect to the inertial reference frame with the origin in the complex centre of mass, where the position of the first atom A of A–B–H–C–D or A–B–C along the z axis is chosen to be the most positive.
The ionic complexes N2HN and COHOC+ have linear centrosymmetric
equilibrium structures. The complex OCH+···CO is asymmetric with a barrier height to the centrosymmetric
saddle point OCHCO+(TS), seen at 358 cm-1 in Fig. 2a. In
the mixed-cluster ions, the proton is bound either to CO, when N2··· HCO+ is formed, or to
N2, when
N2H+···OC is formed. Comparison of Tables 8 and 9 shows that the geometric
parameters experience prominent changes (up to 0.01–0.02 Å) upon complexation. In this
fashion, the ionic (molecular) complexes differ from van der Waals complexes, in which the
monomers preserve their geometric parameters to a great extent.
Properties of the ionic complexes from the CCSD(T)/aug-cc-pVTZ calculations.
Properties of the monomers CO, N2, HCO+, HOC+, and N2H+ from the CCSD(T)/aug-cc-pVTZ calculations.
The transformations in Fig. 2 are all of the proton transfer type. The neutral CO may approach H+ of the triatomic cation either with C or O since both C and O possess lone electron pairs. The proton attachment from the C side leads to a more stable complex. As seen in Fig. 2a, the complex OCH+···OC is 1785 cm-1 above OCH+···CO and 9615 cm-1 below COHOC+. We also see that N2···HCO+ is 6996 cm-1 more stable than N2H+···OC. In all cases, the energy separation between the HCO+- and HOC+-containing complexes is smaller than the separation between free HCO+ and HOC+, seen to be 13 820 cm-1 in Fig. 2. The results of Fig. 2 are consistent with the fact that the proton tends to localize on the species with higher proton affinity. The experimental proton affinity is 594 kJ mol-1 (49 654 cm-1) for CO on the C end and 427 kJ mol-1 (35 694 cm-1) for CO on the O end (Freeman et al. 1987). The experimental proton affinity of 498 kJ mol-1 (41 629 cm-1) was determined for N2 (Ruscic & Berkowitz 1991).
Isotopic variants of the ionic complex OCH+··· CO.
The harmonic wavenumbers for the ionic complexes occurring in the course of reactions
F1–F6 are provided in Table 10. In addition to the
spectroscopic properties, we also give the harmonic zero-point energies of the complexes
E0, the reactants
 , and the products
 , as well as the dissociation energies
including the harmonic zero-point energy correction in the direction of the reactants,
, as well as the dissociation energies
including the harmonic zero-point energy correction in the direction of the reactants,
 , and in the direction of the products,
 , where De is the
classical dissociation energy.
, where De is the
classical dissociation energy.
In Table 10, the vibrational mode ω2, which is predominantly the diatom CO stretching vibration, is the most sensitive to isotopic substitutions. Compared with ω of free CO, ω2 exhibits a blue-shift of 93 cm-1 for the main isotopologue (Table 9 vs. Table 8). The modes ω1 and ω3, highly sensitive to the H→D substitution (Table 8), can be considered as the H-C-O stretching modes. The intermolecular stretching mode is ω8. The zero-point-corrected dissociation energies in Table 10 are approximately 240 cm-1 lower than the electronic dissociation energy of 4876 cm-1 (Fig. 2). The harmonic ΔEh/kB values in Table 10 and anharmonic ΔE/kB values in Table 2 agree within 0.5 K.
The proton-bound complexes OCH+···
CO and N2···
HCO+ have large dipole moments μe of 1.16
ea0 (2.94 D) and 1.39
ea0 (3.53 D) (Table 8).
For OCH+··· CO, the
most intense infrared transitions are expected for ω3 (with
harmonic intensity  of 2440 km mol-1) and ω1
(
of 2440 km mol-1) and ω1
( km mol-1), whereas the intermolecular
stretch ω8 has
km mol-1), whereas the intermolecular
stretch ω8 has
 km mol-1. The fundamental (anharmonic)
transitions (ν1,ν2,ν3,ν4,5,ν6,7,ν8,ν9,10)
are calculated to be (2267, 2236, 1026, 1136, 346, 186, 208) for the main isotopologue (in
cm-1). The most
intense infrared active transitions for N2··· HCO+ are ω1
(
km mol-1. The fundamental (anharmonic)
transitions (ν1,ν2,ν3,ν4,5,ν6,7,ν8,ν9,10)
are calculated to be (2267, 2236, 1026, 1136, 346, 186, 208) for the main isotopologue (in
cm-1). The most
intense infrared active transitions for N2··· HCO+ are ω1
( km mol-1), ω3
(
km mol-1), ω3
( km mol-1), and ω8
(
km mol-1), and ω8
( km mol-1). For this complex, the
fundamental vibrational (ν1,ν2,ν3,ν4,5,ν6,7,ν8,ν9,10)
transitions are determined to be (2357, 2321, 1876, 1045, 127, 186, 113) (in
cm-1). The
anharmonic transitions are calculated from the cubic and semi-diagonal quartic force field
in a normal coordinate representation by means of vibrational second-order perturbation
theory, as implemented in CFOUR (Stanton et al.
2012).
km mol-1). For this complex, the
fundamental vibrational (ν1,ν2,ν3,ν4,5,ν6,7,ν8,ν9,10)
transitions are determined to be (2357, 2321, 1876, 1045, 127, 186, 113) (in
cm-1). The
anharmonic transitions are calculated from the cubic and semi-diagonal quartic force field
in a normal coordinate representation by means of vibrational second-order perturbation
theory, as implemented in CFOUR (Stanton et al.
2012).
Regarding the CCSD(T)/aug-cc-pVTZ method used here, we may note that our value of 358
cm-1 in Fig.
2a for the barrier height of OC+HCO+ agrees reasonably well with
previous theoretical results of 382 cm-1 (the CCSD(T)/cc-pVQZ approach of Botschwina et al. 2001) and 398 cm-1 (the CCSD(T)/aug-cc-pVXZ
approach of Terrill & Nesbitt 2010 at the
complete basis-set limit). A classical dissociation energy was previously determined to be
4634 cm-1 for
OCH+··· CO and
5828 cm-1 for
N2HN at the complete basis-set limit (Terrill & Nesbitt 2010). The use of larger basis
sets would ultimately be needed for converging theoretical results to stable values. Our
primary goal here is the acquisition of first information relevant for the physical
behaviour of the ionic complexes involving HCO+ and N2H+. For these initial explorations of the PESs, the
CCSD(T)/aug-cc-pVTZ approach is of satisfactory quality. A more detailed analysis of
various basis-set effects, including the basis-set superposition error in systems with
significantly deformed monomers, is being prepared and will be presented elsewhere.
5. Conclusion
Ion-molecule reactions are common in interstellar space, and investigating them helps to quantitatively understand the molecular universe (Watson 1976). We studied the isotope fractionation reactions of HCO+/HOC+ with CO and N2H+ with N2, as well as the linear proton-bound complexes formed in the course of these reactions. For OCH++CO, we pointed out inaccuracies of previous exothermicity values that are commonly employed in chemical networks. The new exothermicities affect particularly prominently the rate coefficients derived at temperatures of dark interstellar cloud environments, which markedly changes the abundance ratios of the 13C- and 18O-containing formyl isotopologues.
The linear proton-bound cluster ions are found to be strongly bound (2000–7000 cm-1). The ionic complexes OCH+··· CO and OCH+··· N2 have sizeable dipole moments (2.9–3.5 D) and rotational constants of approximately 2000 MHz. If stabilized by means of collision and/or radiative processes, their high rotational population may facilitate the detection of these ions at low temperatures.
Acknowledgments
M.M. is grateful to Geerd H. F. Diercksen for sending her a copy of the MPI/PAE Astro 135 report. Marius Lewerenz is acknowledged for helpful discussions. Mila Lewerenz is thanked for helping with the literature search.
References
- Adams, N. G., & Smith, D. 1981, ApJ, 247, L123 [NASA ADS] [CrossRef] [Google Scholar]
- Anicich, V. G. 1993, J. Phys. Chem. Ref. Data, 22, 1469 [NASA ADS] [CrossRef] [Google Scholar]
- Bendtsen, J. 2001, J. Ram. Spectrosc., 32, 989 [NASA ADS] [CrossRef] [Google Scholar]
- Bizzocchi, L., Caselli, P., & Dore, L. 2010, A&A, 510, L5 [NASA ADS] [CrossRef] [EDP Sciences] [Google Scholar]
- Bizzocchi, L., Caselli, P., Leonardo, E., & Dore, L. 2013, A&A, 555, A109 [NASA ADS] [CrossRef] [EDP Sciences] [Google Scholar]
- Botschwina, P., Dutoi, T., Mladenović, M., et al. 2001, Faraday Discuss., 118, 433 [NASA ADS] [CrossRef] [Google Scholar]
- Caselli, P., & Dore, L. 2005, A&A, 433, 1145 [NASA ADS] [CrossRef] [EDP Sciences] [Google Scholar]
- Caselli, P., Walmsley, C. M., Zucconi, A., et al. 2002, ApJ, 565, 331 [NASA ADS] [CrossRef] [Google Scholar]
- Dalgarno, A., & Black, J. H. 1976, Rep. Prog. Phys., 39, 573 [Google Scholar]
- Freeman, C. G., Knight, J. S., Love, J. G., & McEwan, M. J. 1987, Int. J. Mass. Spectrum. Ion. Process., 80, 255 [NASA ADS] [CrossRef] [Google Scholar]
- Guelin, M., Langer, W. D., & Wilson, R. W. 1982, A&A, 107, 107 [NASA ADS] [Google Scholar]
- Henning, P., Kraemer, W. P., & Diercksen, G. H. F. 1977, Internal Report, MPI/PAE Astro 135, Max-Planck Institut, München [Google Scholar]
- Herbst, E. 2003, Space Sci. Rev., 106, 293 [NASA ADS] [CrossRef] [Google Scholar]
- Herbst, E., Payzant, J. D., Schiff, H. I., & Bohme, D. K. 1975, ApJ, 201, 603 [NASA ADS] [CrossRef] [Google Scholar]
- Huang, X., Valeev, E. F., & Lee, T. J. 2010, J. Chem. Phys., 133, 4108 [NASA ADS] [Google Scholar]
- Huber, K. P., & Herzberg, G. 1979, Molecular Spectra & Molecular Structure, Vol. IV. Constants of Diatomic Molecules (Englewood Cliffs, Prentice-Hall) [Google Scholar]
- Hugo, E., Asvany, O., & Schlemmer, S. 2009, J. Chem. Phys., 130, 164302 [NASA ADS] [CrossRef] [PubMed] [Google Scholar]
- Jørgensen, J. K., Schöier, F. L., & van Dishoeck, E. F. 2004, A&A, 416, 603 [NASA ADS] [CrossRef] [EDP Sciences] [Google Scholar]
- Langer, W. D., Graedel, T. E., Frerking, M. A., & Armentrout, P. B. 1984, ApJ, 277, 581 [NASA ADS] [CrossRef] [Google Scholar]
- Le Bourlot, J., Forets, G., Pineau Des Roueff, E., & Flower, D. R. 1993, A&A, 267, 233 [NASA ADS] [Google Scholar]
- Liszt, H. S. 2007, A&A, 476, 291 [NASA ADS] [CrossRef] [EDP Sciences] [Google Scholar]
- Lohr, L. L. 1998, J. Chem. Phys., 108, 8012 [NASA ADS] [CrossRef] [Google Scholar]
- Maret, S., Bergin, E. A., & Tafalla, M. 2013, A&A, 559, A53 [NASA ADS] [CrossRef] [EDP Sciences] [Google Scholar]
- Martin, J. M. L., Taylor, P. R., & Lee, T. J. 1993, J. Chem. Phys., 99, 286 [NASA ADS] [CrossRef] [Google Scholar]
- Milam, S. N., Woolf, N. J., & Ziurys, L. M. 2009, ApJ, 690, 837 [NASA ADS] [CrossRef] [Google Scholar]
- Mills, I., Cvitaš, T., Homann, K., Kallay, N., & Kuchitsu, K. 1993, Quantities, Units and Symbols in Physical Chemistry, 2nd edn. (Oxford: Blackwell Scientific Publications) [Google Scholar]
- Mladenović, M., & Bačić, Z. 1990, J. Chem. Phys., 93, 3039 [NASA ADS] [CrossRef] [Google Scholar]
- Mladenović, M., & Schmatz, S. 1998, J. Chem. Phys., 109, 4456 [NASA ADS] [CrossRef] [Google Scholar]
- Olney, T. N., Cann, N. M., Cooper, G., & Brion, C. E. 1997, Chem. Phys., 223, 59 [NASA ADS] [CrossRef] [Google Scholar]
- Pagani, L., Salez, M., & Wannier, P. G. 1992, A&A, 258, 479 [NASA ADS] [Google Scholar]
- Rodgers, S. D., & Charnley, S. B. 2004, MNRAS, 352, 600 [NASA ADS] [CrossRef] [Google Scholar]
- Röllig, M., & Ossenkopf, V. 2013, A&A, 550, A56 [NASA ADS] [CrossRef] [EDP Sciences] [Google Scholar]
- Ruscic, B., & Berkowitz, J. 1991, J. Chem. Phys., 95, 4378 [NASA ADS] [CrossRef] [Google Scholar]
- Schmatz, S., & Mladenović, M. 1997, Ber. Bunsenges. Phys. Chemie, 101, 372 [CrossRef] [Google Scholar]
- Smith, D., & Adams, N. G. 1980, ApJ, 242, 424 [NASA ADS] [CrossRef] [Google Scholar]
- Snyder, L. E., Hollis, J. M., & Watson, W. D. 1977, ApJ, 212, 79 [NASA ADS] [CrossRef] [Google Scholar]
- Špirko, V., Bludský, O., & Kraemer, W. P. 2008, Collect. Czech. Chem. Commun., 73, 873 [CrossRef] [Google Scholar]
- Stanton, J. F., Gauss, J., Harding, M. E., et al. CFOUR, a quantum chemical program package, http://www.cfour.de [Google Scholar]
- Terrill, K., & Nesbitt, D. J. 2010, Phys. Chem. Chem. Phys., 12, 8311 [CrossRef] [Google Scholar]
- Terzieva, R., & Herbst, E. 2000, MNRAS, 317, 563 [NASA ADS] [CrossRef] [Google Scholar]
- Trickl, T., Proch, D., & Kompa, K. L. 1995, J. Mol. Spectrosc., 171, 374 [NASA ADS] [CrossRef] [Google Scholar]
- Urey, H. C. 1947, J. Chem. Soc., 562 [Google Scholar]
- Wagner-Redeker, W., Kemper, P. R., Jarrold, M. F., & Bowers, M. T. 1985, J. Chem. Phys., 83, 1121 [NASA ADS] [CrossRef] [Google Scholar]
- Watson, W. D. 1976, Rev. Mod. Phys., 48, 513 [NASA ADS] [CrossRef] [Google Scholar]
- Werner, H.-J., Knowles, P. J., Knizia, G., et al. 2012, MOLPRO, a package of ab initio programs, http://www.molpro.net [Google Scholar]
All Tables
Zero-point vibrational energies (in cm-1) of isotopologues of CO, HCO+, and HOC+.
Zero-point energy differences (in K) between the reactants and products for the isotope fractionation reactions of H/DCO+ and H/DOC+ with CO.
Zero-point energy differences (in K) between the reactants and products for the isotope fractionation reactions of N2H+ with N2.
Equilibrium constants Ke, partition function factors Fq, and rate coefficients kf,kr (in 10-10 cm3 s-1) for the reactions of H/DCO+ with CO.
Equilibrium constants Ke, partition function factors Fq, and rate coefficients kf,kr (in 10-10 cm3 s-1) for the reactions of N2H+ with N2.
Properties of the monomers CO, N2, HCO+, HOC+, and N2H+ from the CCSD(T)/aug-cc-pVTZ calculations.
All Figures
|
Fig. 1 Temperature dependence of the rate coefficients for N2H+ + N2 for reactions D1 and D6 in a), reactions D2 and D3 in b), and reactions D4 and D5 in c). |
| In the text | |
|
Fig. 2 Minimum energy paths for the linear approach of CO to HCO+/HOC+ in a), for
the linear approach of N2 to HN |
| In the text | |
Current usage metrics show cumulative count of Article Views (full-text article views including HTML views, PDF and ePub downloads, according to the available data) and Abstracts Views on Vision4Press platform.
Data correspond to usage on the plateform after 2015. The current usage metrics is available 48-96 hours after online publication and is updated daily on week days.
Initial download of the metrics may take a while.