| Issue |
A&A
Volume 566, June 2014
|
|
|---|---|---|
| Article Number | L1 | |
| Number of page(s) | 6 | |
| Section | Letters | |
| DOI | https://doi.org/10.1051/0004-6361/201423531 | |
| Published online | 05 June 2014 | |
Glory revealed in disk-integrated photometry of Venus⋆
1
ESA Fellow, ESA/RSSD, ESTEC,
2201 AZ
Noordwijk,
The Netherlands
e-mail:
This email address is being protected from spambots. You need JavaScript enabled to view it.
2
Grupo de Ciencias Planetarias, Departamento de Física Aplicada
I, ETS Ingeniería,
UPV/EHU, 48013
Bilbao,
Spain
3
Unidad Asociada Grupo de Ciencias Planetarias,
UPV/EHU-IAA/CSIC, 48008
Bilbao,
Spain
Received: 29 January 2014
Accepted: 29 April 2014
Abstract
Context. Reflected light from a spatially unresolved planet yields unique insight into the overall optical properties of the planet cover. Glories are optical phenomena caused by light that is backscattered within spherical droplets following a narrow distribution of sizes; they are well known on Earth as localised features above liquid clouds.
Aims. Here we report the first evidence for a glory in the disk-integrated photometry of Venus and, in turn, of any planet.
Methods. We used previously published phase curves of the planet that were reproduced over the full range of phase angles with model predictions based on a realistic description of the Venus atmosphere. We assumed that the optical properties of the planet as a whole can be described by a uniform and stable cloud cover, an assumption that agrees well with observational evidence.
Results. We specifically show that the measured phase curves mimic the scattering properties of the Venus upper-cloud micron-sized aerosols, also at the small phase angles at which the glory occurs, and that the glory contrast is consistent with what is expected after multiple scattering of photons. In the optical, the planet appears to be brighter at phase angles of ~11–13° than at full illumination; it undergoes a maximum dimming of up to ~10% at phases in between.
Conclusions. Glories might potentially indicate spherical droplets and, thus, extant liquid clouds in the atmospheres of exoplanets. A prospective detection will require exquisite photometry at the small planet-star separations of the glory phase angles.
Key words: techniques: photometric / planets and satellites: atmospheres / radiative transfer
Appendices are available in electronic form at http://www.aanda.org
© ESO, 2014
1. Introduction
Clouds occur regularly in the atmospheres of the solar system planets, but it remains extremely challenging to predict where and how they form and what the fundamental properties of the resulting cloud particles will be (Rossow et al. 1978; Sánchez-Lavega et al. 2004). Clouds influence the overall energy balance of a planet, as well as the atmospheric dynamics and surface temperature. Clouds also have an effect on the planet’s appearance as viewed from afar and on our capacity to identify the atmospheric gases. Finding tools for the remote characterisation of clouds has long been a key aspect of planetary research (Coffeen et al. 1979; Knollenberg et al. 1977).
In that respect, Venus is quite unique because it is fully and permanently covered by a complex cloud system (Esposito et al. 1983) and because it can be investigated from Earth over the entire range of Sun-Venus-observer phase angles, also in measurements of the planet’s disk-integrated phase curve. Unlike polarisation phase curves, which can be rich in diagnostic features that provide information about the fundamental properties of the scattering particles in the atmosphere (Bailey 2007; Hansen & Arking 1971; Hansen & Hovenier 1974; Zugger et al. 2010; 2011), photometry is often less informative (Arking & Potter 1968). Features that appear distinctly in the polarisation phase curves of Venus such as the glory, primary rainbow, or anomalous diffraction (Hansen & Arking 1971; Hansen & Hovenier 1974) were key in the investigation of the Venus clouds. Polarimetry is technically more challenging than photometry, however, which is the reason why the latter has traditionally been favoured in studies of planetary atmospheres. Interestingly, the emerging research field of exoplanets is leading to a re-evaluation of the polarimetry potentialities because it offers unique advantages in separating the planet from the (largely unpolarised) stellar glare. Future efforts may need to combine both techniques to overcome the inherent difficulties in this new field. We here investigate the photometric phase curves of Venus that reveal distinct evidence for a glory, which is an optical phenomenon associated with backscattering within spherical droplets.
2. Venus phase curves
For our analysis, we adopted published phase curves for disk-integrated photometry of Venus in four band filters (B, V, R, I; Mallama et al. 2006). The phase curves largely rely on Earth-based observations, but for the B and V bands they also include measurements from the space solar observatory SOHO when the planet is near superior or inferior conjunctions. A similarly obtained phase curve in V band is available for Mercury (Mallama et al. 2002), which has become a standard for investigating Mercury’s opposition surge (Domingue et al. 2010). The measured Venus phase curve for the B band is presented in Fig. 1A (symbols) in the normalised form AgΦ(α) for the 0–180°-range of the phase angle α. Ag is the geometric albedo and measures the planet’s fully illuminated brightness relative to the brightness of a Lambertian disk of identical cross section. The planet phase function, Φ(α) (with Φ(0) ≡ 1), describes the planet’s disk-integrated efficiency for scattering the incident starlight at varying phases on the orbit.
To aid with the interpretation, Fig. 1A presents the phase curve (solid blue line) at the wavelength λ = 0.445 μm as predicted with a multiple-scattering radiative-transport model based on backward Monte Carlo integration (see appendices). For reference, Fig. 1B shows the scattering phase function (i.e. the F11 element of the scattering matrix) for Rayleigh particles, for the so-called mode-1 and mode-2 droplets that dominate the Venus upper cloud, and for a combined Rayleigh/mode-1/mode-2 particle, as obtained with Mie scattering theory at λ = 0.445 μm. Figure 1A generally describes the dimming of Venus as its illuminated fraction decreases from α = 0 to 180°. Two features (I and II, marked in the graph) stand out, one at each end of the phase curve.
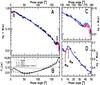 |
Fig. 1 Venus phase curve in the B band and scattering particle phase functions at λ = 0.445 μm. A) Symbols stand for the measured phase curve. Black and red are ground- and space measurements. The solid blue line is our modelled phase curve at λ = 0.445 μm. B) Scattering phase functions for Rayleigh particles, mode-1 and mode-2 droplets, and a combined Rayleigh/mode-1/mode-2 particle. C) Phase curve for α ≥ 130°. Exploration of the model sensitivity to H (=2, purple; 4, cyan) and Δ (=4.7H, dashed; ∞, dashed-dotted). D) Phase curve for α ≤ 50°. |
The local brightness enhancement noted as feature I is caused by grazing starlight scattered towards the observer (Mallama et al. 2006). The forward-scattering peak of mode-2 droplets partly compensates for the shrinking size of the illuminated disk at those phases. Near inferior conjunction, scattered starlight creates a diffuse halo at altitudes where the atmosphere becomes optically thick in limb viewing (García Muñoz & Mills 2012). The halo eventually encircles the planet and contributes effectively to its brightness out to α = 180°. The brightness strongly depends on the vertical stratification of the scattering particles in the atmosphere (see appendices and Fig. 1C). Historically, the varying extension of the halo cusps was key to establishing the existence of a Venus atmosphere (Russell 1899). This diffuse halo differs from the refraction halo that becomes visible during the ingress and egress phases of a Venus transit across the solar disk (García Muñoz & Mills 2012; Tanga et al. 2012). Feature I must not be mistaken for specular reflection at the planet surface, a mechanism that might also produce brightness excesses at large phase angles for planets with a liquid surface (Williams & Gaidos 2008; Robinson et al. 2010).
3. Venus glory
Feature II provides evidence for a so-called (backward) glory (Adam 2002; van de Hulst 1981). It manifests itself in the empirical AgΦ(α) curve of Figs. 1A and D as a distinct local maximum near α ~ 11° and a drop in the planet brightness towards smaller phase angles. The SOHO measurements (limited to α = 6−11°, separate colour code) confirm that trend. The modelled phase curve describes the glory in more detail as the combination of a local minimum at αm ~ 6° and a local maximum at αM ~ 11°. The theoretical contrast Φ(αM)/Φ(αm) between the two local features is ~1.10. This is the first instance that a glory is identified in the disk-integrated photometry of a planet.
In atmospheric optics, a glory is a phenomenon associated with light rays that interfere within spherical droplets through both internal reflection and surface waves that emerge subsequently close to the backscattering direction (Adam 2002; van de Hulst 1981). On Earth, glories are seen above liquid water clouds (Sassen et al. 1998). In the Venus atmosphere, localised glories at wavelengths from the ultraviolet to the near-infrared have recently been spotted from orbit by the ESA Venus Express mission (Markiewicz et al. 2014). There is a clear resemblance between their reported local reflectance curves and the disk-integrated feature II of our Figs. 1A and D. Glories are explained by Mie scattering theory and become inhibited by slight departures from sphericity of the scattering particles (Sassen et al. 1998; Mishchenko et al. 1996). This property makes glories indicators for liquid clouds because only liquid condensates are likely to adopt spherical shapes in naturally occurring clouds.
Taking the Venus clouds as a reference, we explore in Fig. 2 the magnitudes for αm, F11(αM)/F11(αm), Φ(αM)/Φ(αm) and AgΦ(αM) in the space of xeff(=2πreff/λ) and veff parameters that characterise the droplet size distributions (see appendices for a description of these parameters). When multiple local maximae and minimae are present (typically for the smaller veff and xeff ≥ 15), αm and αM specify the phase angles closest to backscattering. The ratio F11(αM)/F11(αm) is included because it modulates the contrast. Left and right panels correspond to refractive indices nr = 1.44 and 1.33, respectively, the latter being broadly representative of water at visible wavelengths. Liquid water is a pre-requisite for life, and liquid water clouds might suggest surface water on a planet (Bailey 2007).
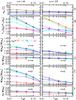 |
Fig. 2 Investigation of the glory in the space of xeff and veff parameters. Left and right panels represent calculations for refractive indices nr = 1.44 and 1.33, respectively. Panels A)–B) are the positions of the local minimum within the glory, αm, and F11(αM)/F11(αm) is the associated contrast based on the scattering phase function. Panels C)–F) incorporate the multiple scattering calculations for the prescribed Venus-based atmospheres. Panels C)–D) are for semi-infinite atmospheres, whereas E)–F) are for atmospheres of finite optical thickness equal to 5 above a black surface. All calculations assume a uniform atmosphere of the specified unimodal size distribution of scattering droplets. In panels C)–F), only configurations leading to Φ(αM)/Φ(αm) > 1 are shown. At λ = 0.445 μm, xeff for Venus and Earth (average effective radius ~6 μm) liquid clouds are ~14 and 85, respectively. |
Figures 2A show that the glory concentrates at a location close to backscattering as the droplet effective radius increases. Theory predicts that the glory angular width is proportional to 1/xeff (Adam 2002). As a rule (Figs. 2B), F11(αM)/F11(αm) increases as veff decreases, meaning that narrow size distributions lead to stronger contrasts. The dependence of F11(αM)/F11(αm) on xeff is less obvious. For either sufficiently large or sufficiently small particles the glory becomes smeared out, and there appears to be an optimum xeff (~10–15 for nr = 1.44) that maximizes F11(αM)/F11(αm). For Venus, xeff ~ 14.1 at λ = 0.445 μm, which is incidentally within the quoted range for the highest glory contrasts.
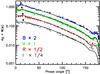 |
Fig. 3 Venus phase curves in the B, V, R, and I bands. The glory shifts towards larger phase angles at longer wavelengths. A forward-scattering peak is clearly discernible in the B, V and R bands. Stars mark the shift of the glory towards larger phase angles for longer wavelengths. |
Figures 2C to F investigate the effect of multiple scattering on the planet phase curves, which is to attenuate the contrast in the disk-integrated glory. For a Venus-thick atmosphere (effectively, τ → ∞) the contrast Φ(αM)/Φ(αm) drops to 1.15 or lower from the higher contrasts suggested by F11(αM)/F11(αm) and sometimes the glory pattern becomes undistinguishable. The model predicts stronger contrasts in thinner atmospheres that lie above a dark surface (compare Figs. 2C and E, for τ = 5), at the expense of the planet appearing darker (compare Figs. 2D and F). Changes in the glory contrast with τ would be different in polarisation because the polarised signal is especially sensitive to the top of the atmosphere (Hansen & Hovenier 1974; Markiewicz et al. 2014). The refractive index has a distinct impact on the glory properties.
We extended the phase curve analysis to all bands in Fig. 3. The model satisfactorily reproduces the V, R and I phase curves without further adjustments in the droplet size distributions and predicts that a distinct forward-scattering peak occurs in V and R as well. The measurements confirm the peak in V but do not allow for a clear conclusion in R. The glory pattern is unequivocally discerned in the empirical phase curves for the B and V bands, and appears as a local change in the curve trends for the R and I bands. The angular width of the glory shifts towards larger phase angles as xeff decreases or, for fixed droplet sizes, as λ increases. The calculated geometric and spherical albedos for each modelled phase curve and the corresponding AgΦ(αm) and Φ(αM)/Φ(αm) are listed in Table 1. We note the potential limitations inherent to estimating the geometric and spherical albedos from measured phase curves with an incomplete coverage of the smaller phase angles.
Photometric properties calculated for the modelled phase curves at all four filters.
4. Glories in the solar system. Venus as an exoplanet
Earth hosts liquid water clouds, and Titan very likely has liquid methane clouds that lead to occasional rain (Hueso & Sánchez-Lavega 2006; Tokano et al. 2006). Phase curves of Earth covering phases near full illumination have not been obtained (Mallama 2009), but high-lying ice clouds (Karalidi et al. 2012) and photometric variability due to weather patterns (Karalidi et al. 2012; Livengood et al. 2011) will probably mask a virtual glory. For Titan, the optically thick haze and ice condensates above the sparse, tropospheric liquid methane clouds will almost certainly prevent potential glories from being viewed from afar. On Jupiter, liquid water clouds are predicted at pressure levels of a few bars (Carlson et al. 1988; Zuchowski et al. 2009), but the overlaying condensates will certainly remove the glory feature (Stam et al. 2004).
Clouds and haze are present on exoplanets over a broad range of planet sizes and orbital distances (Currie et al. 2011; Demory et al. 2013; Evans et al. 2013; Knutson et al. 2014; Kreidberg et al. 2014) and are becoming major hurdles in the investigation of exoplanet atmospheres. It is thus relevant to assess the detectability of exoplanet glories because they might potentially indicate extant liquid clouds. The brightness contrast between a planet and its host star is Fp(α)/F⋆=(Rp/a⋆)2AgΦ(α), where Rp and a⋆ are the planet radius and the planet-star distance respectively. For Venus in V band, AgΦ(αm(,M)) = 0.67(, 0.73), which leads to Fp(αm(,M))/F⋆ = 2.05(, 2.2) × 10-9. The difference, ~1.5 × 10⁻¹⁰, is beyond what can currently be attempted with unresolved photometry of the planet-star system or with ground-based direct imaging, but is within the capacities targeted by the envisioned Terrestrial Planet Finder (TPF) space missions that may some day directly image exoplanets in reflected starlight (Cash 2006; Spergel 2013; Traub & Oppenheimer 2010). Direct imaging, however, is limited to angular separations subtended by the planet-star system, θ, larger than the instrument inner working angle (IWA). Assuming that the planet-star system is seen edge on and at a convenient distance of 5 pc, θ(αm) ~ 18 × 10-3 arcsec in V band. This is smaller than the IWAs ~ 50–75 × 10-3 arcsec contemplated by the proposed TPF missions using either internal coronagraphs (Traub & Oppenheimer 2010) or external occulters (Cash 2006; Turnbull et al. 2012). Note that observing at longer wavelengths extends both αm and the IWA (proportional to λ for the internal coronagraph configuration) and thus cancels a potential gain in an increased αm. The IWA is largely dictated by the occulter-to-telescope distance for the external occulter configuration. The appendices discuss the prospects for glory detection on exoplanets in more detail.
We reported the first ever evidence for a glory in the disk-integrated photometry of Venus and, in turn, of any planet. Because glories arise from scattering within spherical droplets, they are valuable proxies for extant liquid clouds. The detection of exoplanet glories will admittedly be challenging and calls for a TPF space mission. The potential pay-off, however, is remarkable because a glory detection will yield insight into the droplet size distribution and the cloud microphysics and, therefore, into the chemical, thermal, and dynamical conditions in the planet atmosphere. High-precision, multi-wavelength measurements of αm and Φ(αM)/Φ(αm) might in principle give access to the main four cloud/atmospheric parameters that shape the phase curve near superior conjunction, reff, veff, nr, and τ, in a way similar to the retrieval of cloud properties in Earth glory observations (Mayer et al. 2004). However, the technical requirements for capturing such subtleties are beyond the reach of projected exoplanet characterisation missions for the near future. Finally, it is fair to state that the lessons learned from Venus may prove most valuable in the investigation of exoplanet clouds.
Online material
Appendix A: Methods
The backward Monte Carlo model used here (García Muñoz & Pallé 2011; García Muñoz et al. 2011) calculates the starlight reflected from the planet full disk as a function of the star-planet-observer phase angle (Fig. A.1), including the crescent that forms at the edges of the disk approaching inferior conjunction. The model computes the four elements of the Stokes vector and properly handles the planet curvature.
In the calculations, we imposed that the Venus atmosphere is effectively semi-infinite (optical thickness, τ → ∞) and cloud extinction is contributed in a 0.2:1 ratio by a bimodal admixture of so-called mode-1 (effective radius reff = 0.23 μm, and effective variance veff = 0.18), and mode-2 (reff = 1 μm, veff = 0.037) spherical droplets of H2SO4/H2O (75/25% by mass) with real refractive indices nr = 1.45(B), 1.44 (V,R) and 1.43 (I). We also included Rayleigh scattering in a proportion 0.045 × (0.55/λ[μm])4 relative to cloud extinction. The droplet properties were calculated from Mie theory (Mishchenko et al. 2002) assuming gamma distributions for the particle sizes (particle radius density ∝ r(1−3veff) /veffexp( −r/ (reffveff))). The dimensionless parameters xeff(=2πreff/λ) and veff are particularly useful to prescribe the droplet optical properties, including the F11 element of the scattering matrix (Hansen & Travis 1974). Figure A.2 shows the normalised distributions of particle sizes for both mode-1 and mode-2 droplets.
Total extinction decays exponentially in the vertical with a scale height H up to a level ztoa = zcl + Δ above the level zcl (~64–74 km in the Venus atmosphere) of nadir-integrated optical depth equal to one, and is taken to be zero upwards from there. Δ effectively truncates the cloud top without the need to invoke a more elaborate multi-layer description of the Venus upper cloud and haze (Fig. A.3). Photons were assumed to scatter without absorption at the wavelengths of the V (0.55 μm), R (0.658 μm) and I (0.806 μm) filters. In B band (0.445 μm), however, we adopted a uniform single-scattering albedo of 0.9975 that shifts the modelled phase curve down with respect to the fully conservative configuration. This modification accounts for the unknown absorber that confers the patchy appearance seen in imagery at λ ≤ 0.5 μm on the planet (Titov et al. 2008). Our prescriptions provide a simple but realistic description for the upper-cloud region of the Venus atmosphere, with parameter values traceable to various references (Hansen & Hovenier 1974; Crisp 1986, Pollack et al. 1980), and is overall consistent with the prescriptions used in recent investigations of the Venus upper cloud (Ignatiev et al. 2009; Wilquet et al. 2012).
Numerical experiments show that for α ≤ 150° the planet brightness is mainly dictated by the total optical thickness of the atmosphere and the optical properties of the scattering particles. The good match between the empirical and modelled phase curves (after adjusting the atmospheric single-scattering albedo at λ = 0.445 μm) for our standard description of combined mode-1 and mode-2 droplets does not warrant a full exploration of the specific droplet parameters.
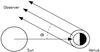 |
Fig. A.1 Integration geometry for the backward Monte Carlo algorithm. Photons are traced back from the observer towards the planet. The integration domain encompasses the entire planet disk projected from the observer site, whether directly illuminated by the star or not. |
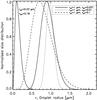 |
Fig. A.2 Normalised gamma distribution for radius sizes of mode-1 and mode-2 droplets (solid curves). The glory is very sensitive to the effective variance, veff, which is a measure of the size distribution width. |
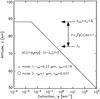 |
Fig. A.3 Sketch that illustrates the meaning of the parameters in our prescribed model atmosphere. |
Thus, the calculations presented in Figs. 1 and 3 make unmodified use of these prescriptions. For α ≥ 150°, however, the brightness becomes very sensitive to the vertical distribution of the scattering particles and thus to H and Δ. We explored H and Δ, reaching the solutions of Figs. 1A and 3 for H = 3 km and Δ = 4.7H = 14.1 km from the visual adjustment of the measured phase curves in the B and V bands, with priority given to SOHO data. Again, these choices are overall consistent with recent investigations of the Venus upper cloud (Ignatiev et al. 2009; Wilquet et al. 2012). Furthermore, Fig. 1C demonstrates the sensitivity of the forward-scattering peak to the two parameters with predicted phase curves for selected values of H and Δ. As a final check, we compared our modelled linear polarisations with available disk-integrated measurements (Hansen & Hovenier 1974); the result of the comparison (not shown) confirmed the validity of the prescribed atmosphere.
Appendix B: Exoplanetary glories?
On a more speculative basis, one may devise more favourable conditions for detecting exoplanet glories, at least theoretically. As a rule, larger planetary radii result in brighter planets that are more likely to stand above the stellar glare. For direct imaging, longer orbital distances would lead to larger angular separations, e.g. θ(αm) ~ 50 × 10-3 arcsec for a⋆ = 2 AU. Planets at such distances might conceivably allow for liquid- (rather than solid-) particle clouds if, for instance, the host star irradiates strongly and thus keeps the planet warm, if the planet is still contracting and therefore heated from below or if it has been externally heated by a catastrophic event (Lupu et al. 2014). In combined planet-star light, in contrast, conditions suitable for a glory detection seem better for close-in planets around faint stars, which might ensure warm temperatures and acceptable contrasts at small a⋆ distances. Planets orbiting white dwarfs represent an example
of the latter as they might host liquid water at the surface (and, arguably, also in the atmosphere) for orbital distances as small as 0.005 AU (Agol 2011). Scaling the Venus glory contrast leads to ~1.5 × 10-10 × (0.73/0.005)2 ~ 3.2 × 10⁻⁶, which is more stringent but not far from precisions of 10-5 obtained by CoRoT and Kepler. For a super-Venus planet twice (thrice) as large as Venus, the contrast increases to 1.3(2.9) × 10-5. Photon collection and instrumental stability will be critical aspects of such endeavours. Obviously, these considerations overlook whether Venus-like glory-forming clouds might form in the conditions we described (or in other planet-star systems that might be postulated), a question that is difficult to address because major uncertainties remain in the processes that govern cloud formation (Cahoy et al. 2010; Gao et al. 2014; Zsom et al. 2012). Glories occur near full illumination, which effectively averages the cloud properties over the planet disk. This characteristic will likely prevent false positives caused by non-uniformities in the planet reflective properties (Cowan et al. 2013).
Acknowledgments
We gratefully acknowledge critical readings of the manuscript by Kate G. Isaak, Ana Heras and Dima V. Titov (all at ESA/ESTEC, the Netherlands) and the constructive comments from Nick Cowan.
References
- Adam, J. A. 2002, Phys. Rep., 356, 229 [NASA ADS] [CrossRef] [Google Scholar]
- Agol, E. 2011, ApJ, 731, L31 [NASA ADS] [CrossRef] [Google Scholar]
- Arking, A., & Potter, J. 1968, J. Atmos. Sci., 25, 617 [Google Scholar]
- Bailey, J. 2007, Astrobiology, 7, 320 [NASA ADS] [CrossRef] [PubMed] [Google Scholar]
- Cahoy, K. L., Marley, M. S., & Fortney, J. J. 2010, ApJ, 724, 189 [NASA ADS] [CrossRef] [Google Scholar]
- Carlson, B. E., Rossow, W. B., & Orton, G. S. 1988, J. Atmos. Sci., 45, 2066 [Google Scholar]
- Cash, W. 2006, Nature, 442, 51 [NASA ADS] [CrossRef] [PubMed] [Google Scholar]
- Coffeen, D. L. 1979, J. Opt. Soc. Am., 69, 1051 [NASA ADS] [CrossRef] [Google Scholar]
- Cowan, N. B., Fuentes, P. A., & Haggard, H. M. 2013, MNRAS, 434, 2465 [NASA ADS] [CrossRef] [Google Scholar]
- Crisp, D. 1986, Icarus, 67, 484 [NASA ADS] [CrossRef] [Google Scholar]
- Currie, T., Burrows, A., Itoh, Y., et al. 2011, ApJ, 729, 128 [NASA ADS] [CrossRef] [Google Scholar]
- Demory, B.-O., de Wit, J., Lewis, N., et al. 2013, ApJ, 776, L25 [NASA ADS] [CrossRef] [Google Scholar]
- Domingue, D. L., Vilas, F., Holsclaw, G. M., et al. 2010, Icarus, 209, 101 [NASA ADS] [CrossRef] [Google Scholar]
- Esposito, L. W., Knollenberg, R. G., Marov, M. Y., Toon, O. B., & Turco, R. P. 1983, in Venus, eds. D. M. Hunten, L. Colin, T. M. Donahue, & V. I. Moroz (Tucson: Univ. of Arizona Press), 484 [Google Scholar]
- Evans, T.M,Pont, F., Sing, D. K., et al. 2013, ApJ, 772, L16 [NASA ADS] [CrossRef] [Google Scholar]
- Gao, P., Zhang, X., Crisp, D., Bardeen, C. G., & Yung, Y. L. 2014, Icarus, in press [Google Scholar]
- García Muñoz, A., & Mills, F. P. 2012, A&A, 547, A22 [NASA ADS] [CrossRef] [EDP Sciences] [Google Scholar]
- García Muñoz, A., & Pallé, E. 2011, JQSRT, 112, 1609 [NASA ADS] [CrossRef] [Google Scholar]
- García Muñoz, A., Pallé, E., Zapatero Osorio, M. R., & Martín, E. L. 2011, Geophys. Res. Lett., 38, L14805 [NASA ADS] [CrossRef] [Google Scholar]
- Hansen, J. E., & Arking, A. 1971, Science, 171, 669 [NASA ADS] [CrossRef] [Google Scholar]
- Hansen, J. E., & Hovenier, J. W. 1974, J. Atmos. Sci., 31, 1137 [NASA ADS] [CrossRef] [Google Scholar]
- Hansen, J. E., & Travis, L. D. 1974, Space Sci. Rev., 16, 527 [NASA ADS] [CrossRef] [Google Scholar]
- Hueso, R., & Sánchez-Lavega 2006, Nature, 442, 428 [NASA ADS] [CrossRef] [Google Scholar]
- Ignatiev, N. I., Titov, D. V., Piccioni, G., et al. 2009, J. Geophys. Res., 114, E00B43 [Google Scholar]
- Karalidi, T., Stam, D. M., & Hovenier, J. W. 2012, A&A, 548, A90 [NASA ADS] [CrossRef] [EDP Sciences] [Google Scholar]
- Knollenberg, R. G., Hansen, J., Ragent, B., Martonchik, J., & Tomasko, M. 1977, Space Sci. Rev., 20, 329 [NASA ADS] [CrossRef] [Google Scholar]
- Knutson, H. A., Benneke, B., Deming, D., & Homeier, D. 2014, Nature, 505, 66 [NASA ADS] [CrossRef] [Google Scholar]
- Kreidberg, L., Bean, J. L., Désert, J.-M., et al. 2014, Nature, 505, 69 [NASA ADS] [CrossRef] [Google Scholar]
- Livengood, T. A., Deming, L. D., A’Hearn, M. F., et al. 2011, Astrobiology, 11, 907 [NASA ADS] [CrossRef] [Google Scholar]
- Lupu, R. E., Zahnle, K., Marley, M. S., et al. 2014, ApJ, 784, 27 [NASA ADS] [CrossRef] [Google Scholar]
- Mallama, A. 2009, Icarus, 204, 11 [NASA ADS] [CrossRef] [Google Scholar]
- Mallama, A., Wang, D., & Howard, R. A. 2002, Icarus, 155, 253 [NASA ADS] [CrossRef] [Google Scholar]
- Mallama, A., Wang, D., & Howard, R. A. 2006, Icarus, 182, 10 [NASA ADS] [CrossRef] [Google Scholar]
- Markiewicz, W. J., Petrova, E., Shalygina, O., et al. 2014, Icarus, 234, 200 [NASA ADS] [CrossRef] [Google Scholar]
- Mayer, B., Schröder, M., Preusker, R., & Schüller, L. 2004, Atmosph. Chem. Phys., 4, 1255 [Google Scholar]
- Mishchenko, M. I., Travis, L. D., & Macke, A. 1996, Appl. Opt., 35, 4927 [NASA ADS] [CrossRef] [Google Scholar]
- Mishchenko, M. I., Travis, L. D., & Lacis, A. A. 2002, Scattering, absorption, and emission of Light by small particles (Cambridge: Cambridge University Press) [Google Scholar]
- Pollack, J. B., Toon, O. B., Whitten, R. C., et al. 1980, J. Geophys. Res., 85, 8141 [NASA ADS] [CrossRef] [Google Scholar]
- Robinson, T. D., Meadows, V. S., & Crisp, D. 2010, ApJ, 721, L67 [NASA ADS] [CrossRef] [Google Scholar]
- Rossow, W. B. 1978, Icarus, 36, 1 [NASA ADS] [CrossRef] [Google Scholar]
- Russell, H. N. 1899, ApJ, 9, 284 [NASA ADS] [CrossRef] [Google Scholar]
- Sánchez-Lavega, A., Pérez-Hoyos, S., & Hueso, R. 2004, Am. J. Phys., 72, 767 [NASA ADS] [CrossRef] [Google Scholar]
- Sassen, K., Arnott, W. P., Barnett, J. M., & Aulenbach, S. 1998, Appl. Opt., 37, 1427 [NASA ADS] [CrossRef] [Google Scholar]
- Spergel, D., Gehrels, N., Breckinridge, J., et al. 2013, Wide-Field InfraRed Survey Telescope-Astrophysics Focused Telescope Assets WFIRST-AFTA. Final Report. [arXiv:1305.5422] [Google Scholar]
- Stam, D. M., Hovenier, J. W., & Waters, L. B. F. M. 2004, A&A, 428, 663 [NASA ADS] [CrossRef] [EDP Sciences] [Google Scholar]
- Tanga, P., Widemann, T., Sicardy, B., et al. 2012, Icarus, 218, 207 [NASA ADS] [CrossRef] [Google Scholar]
- Titov, D. V., Taylor, F. W., Håkan, S., et al. 2008, Nature, 456, 620 [NASA ADS] [CrossRef] [Google Scholar]
- Tokano, T., McKay, C. P., Neubauer, F. M., et al. 2006, Nature, 442, 432 [NASA ADS] [CrossRef] [Google Scholar]
- Traub, W. A., & Oppenheimer, B. R. 2010, Direct imaging techniques, in Exoplanets, ed. S. Seager (University of Arizona Press), 111 [Google Scholar]
- Turnbull, M. C., Glassman, T., Roberge, A., et al. 2012, PASP, 124, 418 [NASA ADS] [CrossRef] [Google Scholar]
- van de Hulst, H. C. 1981, Light scattering by small particles (New York: Dover) [Google Scholar]
- Williams, D. M., & Gaidos, E. 2008, Icarus, 195, 927 [NASA ADS] [CrossRef] [Google Scholar]
- Wilquet, V., Drummond, R., Mahieux, A., et al. 2012, Icarus, 217, 875 [NASA ADS] [CrossRef] [Google Scholar]
- Zsom, A., Kaltenegger, L., & Goldblatt, C. 2012, Icarus, 221, 603 [NASA ADS] [CrossRef] [Google Scholar]
- Zuchowski, L. C., Yamazaki, Y. H., & Read, P. L. 2009, Icarus, 200, 563 [NASA ADS] [CrossRef] [Google Scholar]
- Zugger, M. E., Kasting, J. F., Williams, D. M., Kane, T. J., & Philbrick, C. R. 2010, ApJ, 723, 1168 [NASA ADS] [CrossRef] [Google Scholar]
- Zugger, M. E., Kasting, J. F., Williams, D. M., Kane, T. J., & Philbrick, C. R. 2011, ApJ, 739, 12 [NASA ADS] [CrossRef] [Google Scholar]
All Tables
Photometric properties calculated for the modelled phase curves at all four filters.
All Figures
|
Fig. 1 Venus phase curve in the B band and scattering particle phase functions at λ = 0.445 μm. A) Symbols stand for the measured phase curve. Black and red are ground- and space measurements. The solid blue line is our modelled phase curve at λ = 0.445 μm. B) Scattering phase functions for Rayleigh particles, mode-1 and mode-2 droplets, and a combined Rayleigh/mode-1/mode-2 particle. C) Phase curve for α ≥ 130°. Exploration of the model sensitivity to H (=2, purple; 4, cyan) and Δ (=4.7H, dashed; ∞, dashed-dotted). D) Phase curve for α ≤ 50°. |
| In the text | |
|
Fig. 2 Investigation of the glory in the space of xeff and veff parameters. Left and right panels represent calculations for refractive indices nr = 1.44 and 1.33, respectively. Panels A)–B) are the positions of the local minimum within the glory, αm, and F11(αM)/F11(αm) is the associated contrast based on the scattering phase function. Panels C)–F) incorporate the multiple scattering calculations for the prescribed Venus-based atmospheres. Panels C)–D) are for semi-infinite atmospheres, whereas E)–F) are for atmospheres of finite optical thickness equal to 5 above a black surface. All calculations assume a uniform atmosphere of the specified unimodal size distribution of scattering droplets. In panels C)–F), only configurations leading to Φ(αM)/Φ(αm) > 1 are shown. At λ = 0.445 μm, xeff for Venus and Earth (average effective radius ~6 μm) liquid clouds are ~14 and 85, respectively. |
| In the text | |
|
Fig. 3 Venus phase curves in the B, V, R, and I bands. The glory shifts towards larger phase angles at longer wavelengths. A forward-scattering peak is clearly discernible in the B, V and R bands. Stars mark the shift of the glory towards larger phase angles for longer wavelengths. |
| In the text | |
|
Fig. A.1 Integration geometry for the backward Monte Carlo algorithm. Photons are traced back from the observer towards the planet. The integration domain encompasses the entire planet disk projected from the observer site, whether directly illuminated by the star or not. |
| In the text | |
|
Fig. A.2 Normalised gamma distribution for radius sizes of mode-1 and mode-2 droplets (solid curves). The glory is very sensitive to the effective variance, veff, which is a measure of the size distribution width. |
| In the text | |
|
Fig. A.3 Sketch that illustrates the meaning of the parameters in our prescribed model atmosphere. |
| In the text | |
Current usage metrics show cumulative count of Article Views (full-text article views including HTML views, PDF and ePub downloads, according to the available data) and Abstracts Views on Vision4Press platform.
Data correspond to usage on the plateform after 2015. The current usage metrics is available 48-96 hours after online publication and is updated daily on week days.
Initial download of the metrics may take a while.