| Issue |
A&A
Volume 566, June 2014
|
|
|---|---|---|
| Article Number | L1 | |
| Number of page(s) | 6 | |
| Section | Letters | |
| DOI | https://doi.org/10.1051/0004-6361/201423531 | |
| Published online | 05 June 2014 | |
Online material
Appendix A: Methods
The backward Monte Carlo model used here (García Muñoz & Pallé 2011; García Muñoz et al. 2011) calculates the starlight reflected from the planet full disk as a function of the star-planet-observer phase angle (Fig. A.1), including the crescent that forms at the edges of the disk approaching inferior conjunction. The model computes the four elements of the Stokes vector and properly handles the planet curvature.
In the calculations, we imposed that the Venus atmosphere is effectively semi-infinite (optical thickness, τ → ∞) and cloud extinction is contributed in a 0.2:1 ratio by a bimodal admixture of so-called mode-1 (effective radius reff = 0.23 μm, and effective variance veff = 0.18), and mode-2 (reff = 1 μm, veff = 0.037) spherical droplets of H2SO4/H2O (75/25% by mass) with real refractive indices nr = 1.45(B), 1.44 (V,R) and 1.43 (I). We also included Rayleigh scattering in a proportion 0.045 × (0.55/λ[μm])4 relative to cloud extinction. The droplet properties were calculated from Mie theory (Mishchenko et al. 2002) assuming gamma distributions for the particle sizes (particle radius density ∝ r(1−3veff) /veffexp( −r/ (reffveff))). The dimensionless parameters xeff(=2πreff/λ) and veff are particularly useful to prescribe the droplet optical properties, including the F11 element of the scattering matrix (Hansen & Travis 1974). Figure A.2 shows the normalised distributions of particle sizes for both mode-1 and mode-2 droplets.
Total extinction decays exponentially in the vertical with a scale height H up to a level ztoa = zcl + Δ above the level zcl (~64–74 km in the Venus atmosphere) of nadir-integrated optical depth equal to one, and is taken to be zero upwards from there. Δ effectively truncates the cloud top without the need to invoke a more elaborate multi-layer description of the Venus upper cloud and haze (Fig. A.3). Photons were assumed to scatter without absorption at the wavelengths of the V (0.55 μm), R (0.658 μm) and I (0.806 μm) filters. In B band (0.445 μm), however, we adopted a uniform single-scattering albedo of 0.9975 that shifts the modelled phase curve down with respect to the fully conservative configuration. This modification accounts for the unknown absorber that confers the patchy appearance seen in imagery at λ ≤ 0.5 μm on the planet (Titov et al. 2008). Our prescriptions provide a simple but realistic description for the upper-cloud region of the Venus atmosphere, with parameter values traceable to various references (Hansen & Hovenier 1974; Crisp 1986, Pollack et al. 1980), and is overall consistent with the prescriptions used in recent investigations of the Venus upper cloud (Ignatiev et al. 2009; Wilquet et al. 2012).
Numerical experiments show that for α ≤ 150° the planet brightness is mainly dictated by the total optical thickness of the atmosphere and the optical properties of the scattering particles. The good match between the empirical and modelled phase curves (after adjusting the atmospheric single-scattering albedo at λ = 0.445 μm) for our standard description of combined mode-1 and mode-2 droplets does not warrant a full exploration of the specific droplet parameters.
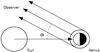 |
Fig. A.1
Integration geometry for the backward Monte Carlo algorithm. Photons are traced back from the observer towards the planet. The integration domain encompasses the entire planet disk projected from the observer site, whether directly illuminated by the star or not. |
| Open with DEXTER | |
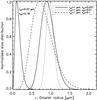 |
Fig. A.2
Normalised gamma distribution for radius sizes of mode-1 and mode-2 droplets (solid curves). The glory is very sensitive to the effective variance, veff, which is a measure of the size distribution width. |
| Open with DEXTER | |
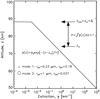 |
Fig. A.3
Sketch that illustrates the meaning of the parameters in our prescribed model atmosphere. |
| Open with DEXTER | |
Thus, the calculations presented in Figs. 1 and 3 make unmodified use of these prescriptions. For α ≥ 150°, however, the brightness becomes very sensitive to the vertical distribution of the scattering particles and thus to H and Δ. We explored H and Δ, reaching the solutions of Figs. 1A and 3 for H = 3 km and Δ = 4.7H = 14.1 km from the visual adjustment of the measured phase curves in the B and V bands, with priority given to SOHO data. Again, these choices are overall consistent with recent investigations of the Venus upper cloud (Ignatiev et al. 2009; Wilquet et al. 2012). Furthermore, Fig. 1C demonstrates the sensitivity of the forward-scattering peak to the two parameters with predicted phase curves for selected values of H and Δ. As a final check, we compared our modelled linear polarisations with available disk-integrated measurements (Hansen & Hovenier 1974); the result of the comparison (not shown) confirmed the validity of the prescribed atmosphere.
Appendix B: Exoplanetary glories?
On a more speculative basis, one may devise more favourable conditions for detecting exoplanet glories, at least theoretically. As a rule, larger planetary radii result in brighter planets that are more likely to stand above the stellar glare. For direct imaging, longer orbital distances would lead to larger angular separations, e.g. θ(αm) ~ 50 × 10-3 arcsec for a⋆ = 2 AU. Planets at such distances might conceivably allow for liquid- (rather than solid-) particle clouds if, for instance, the host star irradiates strongly and thus keeps the planet warm, if the planet is still contracting and therefore heated from below or if it has been externally heated by a catastrophic event (Lupu et al. 2014). In combined planet-star light, in contrast, conditions suitable for a glory detection seem better for close-in planets around faint stars, which might ensure warm temperatures and acceptable contrasts at small a⋆ distances. Planets orbiting white dwarfs represent an example
of the latter as they might host liquid water at the surface (and, arguably, also in the atmosphere) for orbital distances as small as 0.005 AU (Agol 2011). Scaling the Venus glory contrast leads to ~1.5 × 10-10 × (0.73/0.005)2 ~ 3.2 × 10⁻⁶, which is more stringent but not far from precisions of 10-5 obtained by CoRoT and Kepler. For a super-Venus planet twice (thrice) as large as Venus, the contrast increases to 1.3(2.9) × 10-5. Photon collection and instrumental stability will be critical aspects of such endeavours. Obviously, these considerations overlook whether Venus-like glory-forming clouds might form in the conditions we described (or in other planet-star systems that might be postulated), a question that is difficult to address because major uncertainties remain in the processes that govern cloud formation (Cahoy et al. 2010; Gao et al. 2014; Zsom et al. 2012). Glories occur near full illumination, which effectively averages the cloud properties over the planet disk. This characteristic will likely prevent false positives caused by non-uniformities in the planet reflective properties (Cowan et al. 2013).
© ESO, 2014
Current usage metrics show cumulative count of Article Views (full-text article views including HTML views, PDF and ePub downloads, according to the available data) and Abstracts Views on Vision4Press platform.
Data correspond to usage on the plateform after 2015. The current usage metrics is available 48-96 hours after online publication and is updated daily on week days.
Initial download of the metrics may take a while.