Fig. 1
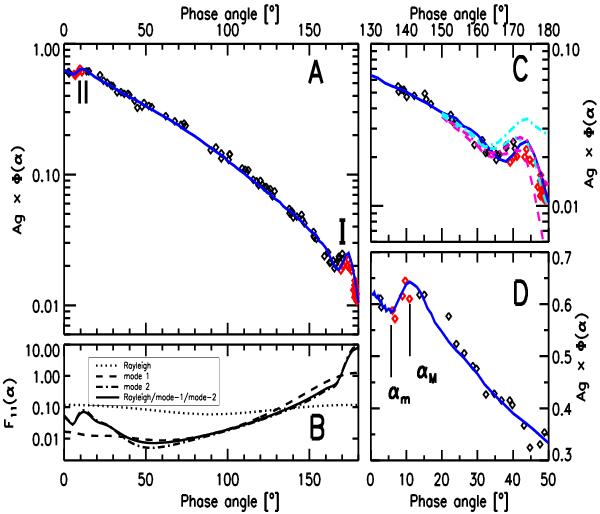
Venus phase curve in the B band and scattering particle phase functions at λ = 0.445 μm. A) Symbols stand for the measured phase curve. Black and red are ground- and space measurements. The solid blue line is our modelled phase curve at λ = 0.445 μm. B) Scattering phase functions for Rayleigh particles, mode-1 and mode-2 droplets, and a combined Rayleigh/mode-1/mode-2 particle. C) Phase curve for α ≥ 130°. Exploration of the model sensitivity to H (=2, purple; 4, cyan) and Δ (=4.7H, dashed; ∞, dashed-dotted). D) Phase curve for α ≤ 50°.
Current usage metrics show cumulative count of Article Views (full-text article views including HTML views, PDF and ePub downloads, according to the available data) and Abstracts Views on Vision4Press platform.
Data correspond to usage on the plateform after 2015. The current usage metrics is available 48-96 hours after online publication and is updated daily on week days.
Initial download of the metrics may take a while.