| Issue |
A&A
Volume 566, June 2014
|
|
|---|---|---|
| Article Number | A15 | |
| Number of page(s) | 7 | |
| Section | Extragalactic astronomy | |
| DOI | https://doi.org/10.1051/0004-6361/201323303 | |
| Published online | 02 June 2014 | |
The radio core structure of the luminous infrared galaxy NGC 4418
A young clustered starburst revealed?
1
Department of Earth and Space SciencesChalmers University of Technology,
Onsala Space Observatory,
439 92
Onsala,
Sweden
e-mail:
This email address is being protected from spambots. You need JavaScript enabled to view it.
2
Jodrell Bank Centre for Astrophysics, Alan Turing Building, School
of Physics and Astronomy, The University of Manchester, Manchester
M13 9PL,
UK
3
Instituto de Astrofísica de Andalucía,
Glorieta de la Astronomá, s/n,
18008
Granada,
Spain
4
Max-Planck-Institut für Radioastronomie,
auf dem Hügel 69, 53121
Bonn,
Germany
Received: 20 December 2013
Accepted: 13 February 2014
Abstract
Context. The galaxy NGC 4418 contains one of the most compact obscured nuclei within a luminous infrared galaxy (LIRG) in the nearby Universe. This nucleus contains a rich molecular gas environment and an unusually high ratio of infrared-to-radio luminosity (q-factor). The compact nucleus is powered by either a compact starburst or an active galactic nucleus (AGN).
Aims. The aim of this study is to constrain the nature of the nuclear region (starburst or AGN) within NGC 4418 via very-high-resolution radio imaging.
Methods. Archival data from radio observations using the European Very Long Baseline Interferometry Network (EVN) and Multi-Element Radio Linked Interferometer Network (MERLIN) interferometers are imaged. Sizes and flux densities are obtained by fitting Gaussian intensity distributions to the image. The average spectral index of the compact radio emission is estimated from measurements at 1.4 GHz and 5.0 GHz.
Results. The nuclear structure of NGC 4418 visible with EVN and MERLIN consists of eight compact (<49 mas i.e. <8 pc) features spread within a region of 250 mas, i.e. 41 pc. We derive an inverted spectral index α ≥ 0.7 (Sν ∝ να) for the compact radio emission.
Conclusions. Brightness temperatures >104.8 K indicate that these compact features cannot be HII-regions. The complex morphology and inverted spectrum of the eight detected compact features is evidence against the hypothesis that an AGN alone is powering the nucleus of NGC 4418. The compact features could be super star clusters with intense star formation, and their associated free-free absorption could then naturally explain both their inverted radio spectrum and the low radio-to-IR ratio of the nucleus. The required star formation area density is extreme, however, and close to the limit of what can be observed in a well-mixed thermal/non-thermal plasma produced by star formation, and is also close to the limit of what can be physically sustained.
Key words: galaxies: Seyfert / galaxies: star formation / galaxies: individual: NGC 4418
© ESO, 2014
1. Introduction
The galaxy NGC 4418 (IRAS 12243-0036) is a luminous (LFIR > 1011 L⊙) infrared galaxy (LIRG) with an infrared flux density more than 5 times larger than expected from the linear radio to far-infrared (FIR) relation. Yun et al. (2001) find only ten such objects in a sample of 1809 galaxies, which makes NGC 4418 a very unusual object. The galaxy has one of the deepest mid-IR silicate absorption features ever detected towards an external galaxy indicating a very deeply obscured nucleus. The deep absorption and high IR brightness of NGC 4418 was first noted by Roche et al. (1986) who proposed that this galaxy hides either an active galactic nucleus (AGN) or a compact nuclear starburst. Very faint Hα emission has been detected, but the absence of NII, OI, and SII emission makes it difficult to classify the galaxy as an AGN or starburst based on its optical spectrum (Armus et al. 1989). Furthermore, near-IR and mid-IR observations are consistent with both hypotheses (Evans et al. 2003).
Millimetre and submm observations by Sakamoto et al. (2013) and Costagliola et al. (2013) reveal the presence of a highly compact (<0.̋1) high surface brightness continuum source suggesting that the bulk of the galaxy FIR emission emerges from a source less than 20 pc in diameter. The extreme inferred H2 column density >1025 cm-2 towards this nucleus (González-Alfonso et al. 2012) makes it extremely difficult to determine the nature of the buried source.
Despite extensive studies of NGC 4418, the nature of its central power source is not clear. High-resolution radio very long baseline interferometry (VLBI) observations provide a possible way to distinguish between AGNs and starbursts. If the source of emission is an AGN this may produce high brightness temperature compact radio components. If the source of emission is a young starburst this would instead produce multiple supernovae (SNe) and supernova remnants (SNRs). A mix between these two scenarios, i.e. AGN and SNe/SNRs, is also possible.
Radio VLBI observations with (sub)milli arcsecond resolution have proven to be a valuable tool to distinguish between these scenarios by directly probing the central regions (U)LIRGs, e.g. for Arp 220 (Batejat et al. 2011) and Arp 299 (Bondi et al. 2012). In this paper we report on the analysis of archival NGC 4418 data from the EVN and MERLIN interferometers which for the first time reveal eight discrete compact radio features within its nucleus.
In Sect. 2 we summarise the data used and the calibration procedures applied. In Sect. 3 we describe the imaging process and discuss the image fidelity. In Sect. 4 we present the results of the imaging and simple modelling. In Sect. 5 we briefly discuss the hypotheses of AGN/starburst in relation to our results. Finally, in Sect. 6 we summarise our conclusions. In this paper we assume a distance of 34 Mpc to NGC 4418 at which an angular size of 1 mas corresponds to 0.165 pc (Costagliola et al. 2013).
2. Data and calibration
We analysed archival data from a combined EVN and MERLIN experiment (EB019, P.I.: P. Barthel) observed at frequency 5.0 GHz taken on 3 June 2001. The observation spanned 5.5 h with 2.8 h integration time on NGC 4418. These data were analysed in two ways: using only the MERLIN data, and as a combined dataset with both EVN and MERLIN visibilities. Below in Sects. 2.1 and 2.2 we describe the calibration of the EVN and MERLIN data. In Sect. 2.3 we then present the details of how images were obtained from the MERLIN-only and EVN and MERLIN data sets.
2.1. Calibration of the MERLIN data
The MERLIN observations were taken without the Lovell Telescope. The data were calibrated using standard procedures. The sources J1232-0224 and J1229+0203 were used as phase calibrators, 3C 286 as primary flux density calibrator, J0555+3948 as secondary flux density calibrator, and OQ208 to derive bandpass solutions. These data have been published before by Costagliola et al. (2013). We use the same calibrated dataset here and for further details of the calibration process we refer the reader to Sect. 2.1 of Costagliola et al. (2013).
2.2. Calibration of the EVN data
The EVN observations included eight antennas (only a part of the full EVN): Effelsberg (100 m diameter), Jodrell Bank Mk2 (25 m), Medicina (32 m), Noto (32 m), Torun (32 m), Westerbork (14 × 25 m), Onsala (25 m), and Cambridge (32 m).
The source J1229+0203 (3C 273), 3.0° from NGC 4418, was observed once every 25 min to track instrumental delay and rate variations and J1232-0224, 2.0° from NGC 4418, was observed as phase calibrator in duty cycles of 4 min/2.5 min with NGC 4418. The parallel-hand products (RR and LL) were correlated and recorded in four sub-bands (IFs) of 16 channels each containing a total bandwidth of 32 MHz.
Calibration of the EVN dataset was done using standard procedures within the Astronomical Image Processing System (AIPS; Greisen 2003), ParselTongue 2.0 (Kettenis et al. 2006), and Difmap (Shepherd 1997). First, bandpass corrections were derived using J1229+0203. Then, bad data were edited using standard procedures in AIPS. After editing, residual delays and rates were corrected for on J1229+0203 and J1232-0224, using the global fringe fitting algorithm (see e.g. Thompson et al. 2001) as implemented in AIPS. The flux scale was set from a priori gain and system temperature measurements.
Since J1232-0224 is resolved at EVN baselines, the data were loaded into Difmap and phase solutions found by executing several self-calibration/clean iterations with an averaging time of 10 min, followed by amplitude and phase self-calibration with an averaging time of 30 min. Then, amplitude self-calibration was done on J1232-0224 in AIPS using averaging times of 100 min to correct for obvious global offsets in the a priori amplitude calibration of a subset of antennas. Finally, the amplitude and phase corrections derived on the calibrator were transferred and applied to the target source. No self-calibration was done using the target source itself.
2.3. Combining the data from EVN and MERLIN
Once the 5 GHz EVN and MERLIN observations had been independently calibrated, the data were exported to the program CASA (McMullin et al. 2007), version 3.4, and concatenated into one measurement set using the task CONCAT. We then used the ms-tool in CASA to scale the amplitudes of the EVN visibilities to those of MERLIN at similar baseline lengths as done previously by Perucho et al. (2012). To ensure positional alignment the phase calibrator J1232-0224 was checked to have the same coordinates in both the EVN and the MERLIN data sets; after imaging J1232-0224 the peak was found to be at RA 12h32m0.016s, Dec  in both data sets.
3. Imaging
In this section we describe the deconvolution of the MERLIN-only data and of the combined EVN and MERLIN data. We also discuss the fidelity of the EVN and MERLIN image.
3.1. MERLIN-only at 5 GHz
An image at 5.0 GHz using data from MERLIN-only (no EVN) was obtained using the CLEAN algorithm as implemented in CASA 3.4 and is shown in Fig. 1. The calibrated visibilities were weighted relative to each other using the Briggs weighting scheme (Briggs 1995) with robust parameter 0.
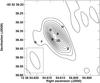 |
Fig. 1 MERLIN-only continuum image of NGC 4418 at 5.0 GHz. Contour levels are (−2,2,4,6,8,10,12,14,16,18,20,22,24,26,28) times the noise root mean square (rms) σ = 300 μJy/beam. We note that there are no negative features as strong as − 2σ, hence no dashed contours. The CLEAN restoring PSF of FWHM 105 mas×42 mas is plotted in the lower left inset. The labels A–H mark the positions of the compact features seen in Fig. 2. The label S (close to label C) corresponds to the 860 μm continuum peak position from Sakamoto et al. (2013). |
3.2. EVN and MERLIN at 5 GHz
The combined dataset was imaged using the deconvolution algorithm CLEAN as implemented in CASA 3.4. To maximise the sensitivity the calibrated visibilities were tapered using a 7.5 Mλ Gaussian taper and weighted using natural weighting. The multi-scale option was used in CLEAN to improve deconvolution of more extended features. Careful conservative masking was done to minimise the risk of creating spurious sources from side lobes in the point spread function (PSF). Figure 2 shows the deconvolved image.
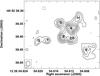 |
Fig. 2 EVN and MERLIN 5 GHz image of NGC 4418 with relative weight 1.0 between the EVN and MERLIN data. The contour levels are (−2,2,4,6,8,10,12,14,16) times the rms noise of σ = 90 μJy/beam. Eight compact features are visible above 5σ labelled from A to H. The label S (close to label C) corresponds to the 860 μm continuum peak position from Sakamoto et al. (2013). The CLEAN restoring PSF of FWHM 20.6 mas×14.8 mas is plotted in the lower left corner. |
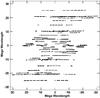 |
Fig. 3 Coverage of the Fourier plane for the EVN data, plotted as V vs. U in units of Mλ. The discrete set of spatial scales sampled in delineation is mainly due to the small (close to 0) declination of NGC 4418. The concatenation of the MERLIN data adds shorter baselines in the centre of less than about 3 Mλ. |
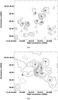 |
Fig. 4 5 GHz EVN and MERLIN images of NGC 4418 with different relative weighting. In a) the weight of the EVN is increased by a factor of ten with respect to MERLIN. As expected, the features F and G are still prominent, but the features A, B, C, D, E, and H are weaker. In b) the weights of MERLIN data are increased by a factor of ten with respect to the EVN. F and G are now lost in the noise, but we still see A, B, C, D, E, and H. The noise rms increases to 95 μJy/beam for panel a) and 150 μJy/beam for b). For easy comparison the contours in panels a) and b) have been set to the same (−2,2,4,6,8,10,12,14,16) times 90 μJy as in Fig. 2. |
Because of the small (close to 0) declination of NGC 4418, limited bandwidth, and missing EVN antennas the observations sample a discrete set of spatial scales in declination (see Fig. 3). This results in a PSF with strong side lobes in declination, reaching in amplitude up to 30% of the peak. When the PSF has strong side lobes there is risk of creating spurious sources in the deconvolution process. To assess the image quality, we performed tests by changing the relative weighting of the data before imaging.
Data for deconvolved images of NGC 4418.
Increasing the relative weight of the EVN should significantly reduce the flux densities of the resolved features A, B, C, D, E, and H compared to the unresolved features F and G. Increasing the relative weights of the EVN data by a factor of ten with respect to MERLIN we obtained what we expected (see Fig. 4a). The reverse experiment, increasing the relative weights of MERLIN data to ten times the EVN, should result in increased flux densities of A, B, C, D, E, and H compared to F and G. Again, we obtained what we expected, see Fig. 4b. The lowest rms noise is obtained when using the same weight for EVN and MERLIN (see Fig. 2). We are confident that the compact features detected here are real.
3.3. Estimates of uncertainties
We estimate the absolute flux density calibration to be accurate to within 10% as given by the MERLIN staff. We assume the EVN flux density scale to be as accurate as MERLIN since we aligned the amplitudes at similar baseline lengths. To account for possible flux density errors in the deconvolution process (e.g. masking effects) we add another 5% uncertainty giving a total accuracy of 15% for measured flux densities.
We estimate an absolute positional calibration accuracy of <1 mas. Given the EVN and MERLIN beam size and image dynamic range of ~17 we estimate a positional uncertainty of 3 mas due to the image noise. We conservatively estimate a total positional uncertainty of 4 mas (a fifth of the major axis of the beam) for the EVN-MERLIN image. Similarly, we estimate an uncertainty of 20 mas for the MERLIN-only peak position.
4. Results and modelling
In this section we present the results obtained from the deconvolved images and from simple Gaussian modelling. All measured and fitted quantities are summarised in Tables 1 and 2.
4.1. Description of the detected structure
Eight compact features are detected brighter than 5σ and are shown in Fig. 2. For reference each feature is labelled from A to H. At 5.0 GHz the synthesised MERLIN-only PSF is relatively large so most of the compact features blend together (Fig. 1). We note, however, that the position of E matches very well with the tail visible to the south-west in Fig. 1. Features F and G are farther away from the rest and, although there are indications, are too weak to be seen clearly with MERLIN-only.
The label S in Figs. 1 and 2 marks the position of the 860 μm peak found by Sakamoto et al. (2013). The PSF of these submillimetre wavelength observations had a size of 350 mas × 260 mas which encompasses all eight of the features we see. Therefore, we cannot say that the 860 μm position is associated with one single radio component. We note, however, that the deconvolved size of FWHM 0.̋10 derived from the 860 μm continuum is very similar to the size of the region occupied by the four brightest radio features labelled A–D in Fig. 2.
The eight detected compact features were modelled using Gaussian intensity distributions and fitted simultaneously to the image using the task IMFIT in CASA 3.4. From IMFIT it was possible to get estimates on the peak and integrated flux densities as well as estimates for the deconvolved (intrinsic) sizes for the eight compact features. The parameters of the best model are given in Table 2. The best model recovers 21.6 mJy which is almost all the flux density of 22.0 mJy found in Fig. 2 by summing all pixels above 3σ. After subtracting the model from the image the maximum residual is 0.4 mJy/beam, i.e. less than 5σ.
4.2. The average spectrum of the compact features
Condon et al. (1990) find a total flux density of about 40 mJy at 1.49 GHz with three different resolutions of 18′′, 5′′, and 1.5′′ using the Very Large Array. From their highest resolution data they estimate a size of 500×300 mas for the nucleus of NGC 4418. Costagliola et al. (2013) find 38 mJy at 1.41 GHz with higher resolution of 350 × 160 mas using MERLIN. Imaging and visibility fitting clearly shows a smooth extended component of FWHM 500 mas, all in good agreement with the previous VLA results. The similar total flux density recovered using MERLIN and the three resolutions of the VLA strongly indicates that there is no evidence for 1.4 GHz emission on scales larger than ~500 mas. However, from the amplitude vs UV-distance plot by Costagliola et al. (2013, their Fig. A.1) it is clear that the total flux density of the 500 mas component detected at 1.4 GHz is ~29 mJy. Subtracting this from the total flux density of 38 mJy gives 9 mJy in compact features, unresolved with MERLIN at 1.4 GHz.
Our modelling (see Sect. 4.1) shows that all 22 mJy detected in Fig. 2 comes from the eight compact features in Fig. 2, each with sizes significantly smaller than the extended 500 mas component detected at 1.4 GHz. We conclude that the emission we see is not associated with the extended emission, and that we should compare the 22 mJy in compact emission at 5.0 GHz to the 9 mJy found at 1.41 GHz. Modelling the spectrum as a simple power law (Sν ∝ να) we derive an inverted spectral index of α ≥ 0.7 for the compact emission. This inverted spectrum is very unusual. Unfortunately we lack high-resolution images at other radio frequency bands than 5 GHz and therefore we cannot investigate the radio spectra of each compact feature in Fig. 2.
5. Discussion
The object NGC 4418 is a luminous infrared galaxy with very unusual properties such as very weak radio compared to IR, very high gas density, and very high dust obscuration. González-Alfonso et al. (2012) proposed a layered-temperature model for the nucleus of NGC 4418. Three layers of different temperature on scales of 100, 20, and 5 pc is also consistent with the MERLIN and SMA observations presented by Costagliola et al. (2013). Based on SMA data Sakamoto et al. (2013) present strong evidence for a compact (~20 pc) core inside a 100 pc scale concentration of molecular gas. Costagliola et al. (2013) based on 1 mm SMA data find an even smaller (<5 pc) hot (~300 K) component in the centre, traced by rotational and vibrational excitation of the molecules HC3N and HNC, in good agreement with the <5 pc component inferred from Hershel mid-IR observations presented by González-Alfonso et al. (2012). To explain the compact emission it has been suggested that NGC 4418 hosts either a radio-weak AGN or a young compact starburst (see e.g. Spoon et al. 2001; and Roussel et al. 2003). A combination of both is also possible.
In this paper we resolve for the first time the structure in the very centre of NGC 4418 into discrete objects. We detect eight compact features within a nuclear region of size 42 pc (see Fig. 2 and Table 2). For the brightest feature A (7 mJy) we find a deconvolved area 28.8 pc2 in good agreement with the hot 25 pc2 component proposed by Costagliola et al. (2013) and González-Alfonso et al. (2012). Next, the four brightest features (A–D) together contain more than half of the total flux density (14 of 22 mJy) detected at 5.0 GHz in an area (using Eq. (4) by Condon et al. 1991 and the sizes in Table 2) of about 100 pc2. This roughly fits the area of π102 = 310 pc2 suggested by Sakamoto et al. (2013).
As noted in Sect. 4.2 an extended 500 mas scale radio component is found at 1.41 GHz by Costagliola et al. (2013) corresponding to a linear size of 80 pc. This larger scale structure together with the four weakest features E, F, G, and H (spread over a region of ~40 pc) in Fig. 2 could very well be the structure responsible for the outer layer of size ~100 pc traced by CO and HI emission (Costagliola et al. 2013). The 22 mJy we find at 5.0 GHz can also be compared with the 26.1 mJy obtained previously at 4.8 GHz with the VLA by Baan & Klöckner (2006). Since the VLA is sensitive to much larger spatial scales, this could indicate the presence of an extended component at 5.0 GHz, possibly the same 500 mas structure detected at 1.4 GHz.
In the following sections we briefly discuss the observed multiple radio features and the overall inverted spectrum in relation to the AGN/starburst models for the power source of NGC 4418.
5.1. An active galactic nucleus
Several authors have suggested that an AGN is present in the nucleus of NGC 4418, mainly because of the high IR brightness and lack of significant emission from polycyclic aromatic hydrocarbon (PAH), see e.g. Spoon et al. (2001). Maiolino et al. (2003) observed NGC 4418 with Chandra finding “evidence for a flat spectrum emission component which may imply the presence of a Compton-thick AGN, but the limited photon statistics make this identification somewhat tentative”. A Compton thick AGN would be consistent with the high H2 column density of >1025 cm-2 inferred by González-Alfonso et al. (2012). If the nucleus of NGC 4418 does harbour a radio-emitting AGN we expect a linear radio structure, for example jets or lobes straddling a central accretion region. Instead, we see a rich non-linear structure of several features in Fig. 2, which argues against the radio emission coming from only an AGN. We note that the complex structure is not evidence against an AGN; some part of the structure (e.g. the linear structure B-A-H) could be due to an AGN, but an AGN alone cannot explain all the features we see.
The inverted radio spectrum could be caused by attenuation of synchrotron radiation from an AGN at 1.4 GHz due to either synchrotron self-absorption or foreground thermal (free-free) absorption. At GHz frequencies synchrotron self-absorption is only important for sources with brightness temperatures >1010 K (e.g. Condon (1992) Sect. 4.1), i.e. much higher than the ~105 derived in Table 2 for the bright resolved features, for example A–D. There are cases of thermal absorption in AGN where the absorption is suggested as due to the subparsec scale accretion disk, for example NGC 1068 (Gallimore et al. 1996) and NGC 4261 (Jones et al. 2001). This scenario is an unlikely explanation for the overall spectrum of the nucleus of NGC 4418, where the compact radio emission is distributed over tens of parsecs.
Gallimore & Beswick (2004) present radio VLBI observations at several epochs and frequencies of the LIRG NGC 6240 which appears to host a pair of AGNs in addition to a starburst. The radio-morphology of NGC 6240 is different from NGC 4418, with one source being compact (<2 pc) and the other showing a linear structure common for AGN. Both AGN have inverted spectra below 2.4 GHz, suggesting strong free-free absorption on scales smaller than 25 pc. It is not clear if this relatively large absorbing medium is associated with the two AGNs or if it is due to star formation between the two nuclei.
To our knowledge there is no clear evidence of thermal absorption in AGNs on scales of tens of parsec required here without a coexistent burst of star formation. This implies that the observed inverted radio spectrum seen in the nucleus of NGC 4418, like the radio morphology, cannot be only due to an AGN and implies that there must be a strong starburst component.
5.2. Starburst
A starburst will produce HII-regions, SNe and SNRs. The HII-regions can be radio bright due to thermal (free-free) emission from the ionised gas, with brightness temperatures up to 2 × 10⁴ K (see e.g. Sect. 11.2.1 in Wilson et al. 2009). Most of the compact features detected in Fig. 2 have brightness temperatures above 105 K (only E and G are below 105 K, see Table 2), effectively ruling out the possibility of the features A–H being HII-regions.
5.2.1. Single SNe/SNRs
Supernovae and supernova remnants can be radio bright because of synchrotron emission in the expanding shell. The environment in the nucleus of NGC 4418 is thought to be similar (e.g. the high density) to what is found in the nuclear regions of Arp 220. If the features A–H were single SNRs we would expect them to follow the luminosity-size relation as SNe/SNRs do in Arp 220 and M82 (see Fig. 5 in Batejat et al. 2011). Assuming a typical spectral index observed for an SNR in Arp 220 Batejat et al. (2011), this implies an equivalent 3.6 cm spectral luminosity of L3.6 cm = 1700 × 1024 erg/s/Hz for a typical 2 mJy (at 6 cm) feature in NGC 4418 at distance 34 Mpc. This corresponds to SNRs in Arp 220 of size ≈0.3 pc, i.e. significantly smaller than sizes observed for A, B, C, D, E, and H (listed in Table 2), strongly indicating that these features are not single SNe/SNRs. Features F and G are unresolved in Fig. 2 and are still compatible with being SNe/SNRs.
5.3. Super star clusters
While the brightest features are probably not single SNe/SNRs they might be super star clusters (SSCs) with intense star formation. Sakamoto et al. (2013) note that a starburst in nucleus of NGC 4418 could be in the form of massive star clusters compatible with the observed high luminosity/mass ratio of 500−1000 . This high L/M ratio is comparable to the theoretical maximum of 500−1000
 for a cluster-forming gas cloud or disk (see Scoville 2003; Thompson et al. 2005). This limit arises because too much radiation pressure will blow away the star forming gas and halt the star formation. The limit is, however, strictly valid for steady state star formation, and it is possible to get even higher ratios for a short while. The observed ratio for NGC 4418 is high, but does not rule out star formation powering the nucleus.
The size of an SSC can be estimated from its mass using the equation rcl ~ 0.3(Mcl/ 106 M⊙)3/5 pc by Murray (2009). Assuming the total SSC mass of Mdyn − Mbh − Mmol = 9 × 10⁷ M⊙ (with values from Table 8 by Sakamoto et al. 2013) is shared by the eight detected features according to their relative 5 GHz luminosity, we estimate SSC diameters of 1.3−4.5 pc, in good agreement with the observed sizes.
Young massive SSCs of similar mass have been detected by optical imaging of the blue compact galaxy ESO 338-IG04 by Östlin et al. (2007) who find a 107 M⊙ SSC of age 6 Myr. These objects are sites of intense compact star formation that can be observed in the optical thanks to the absence of the thick dust common in nuclei of LIRGs such as NGC 4418 and Arp 220.
A young high-mass SSC must have a very large number of Wolf-Rayet (WR) stars whose existence could in theory be confirmed by optical spectroscopy (Armus et al. 1988). Armus et al. (1989) present optical spectra of NGC 4418, but do not detect any WR emission. The absence of WR signatures could argue against a young starburst, but could also be explained by the extreme exctinction (N(H2) > 1025 cm-2; González-Alfonso et al. 2012) towards the nucleus of NGC 4418.
If the nucleus of NGC 4418 is powered by SSCs with intense star formation, the low ratio of radio/FIR emission (q = 3.075 by Yun et al. 2001) might be partly explained by the thermal absorption of intense star formation as shown in Fig. 5, but also by the star burst being young (<5 Myear, suggested by Sakamoto et al. 2013). Such a young starburst would not yet be producing the full rate of radio supernovae corresponding to its current star formation rate as estimated from the infrared luminosity, and hence would not fit the FIR-Radio correlation for older starbursts.
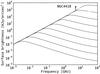 |
Fig. 5 Radio brightness spectra for star formation powered radio emission based on the mixed synchrotron/thermal model of Condon et al. (1991) (see Eq. (1)) assuming a 10% free-free emission contribution at 1.4 GHz. Successive curves correspond to increasing the frequency at which the free-free optical depth is τ = 1 which, using Eq. (3), translates to successive curves of star formation rate density: 10-3, 10-2, 10-1, 100, 101, 102, 103, 104, and 105 [ M⊙ yr-1 kpc-2 ]. The average surface brightness of the resolved features A, B, C, D, E, and H detected at 5.0 GHz in Fig. 2 is marked with a star. The highest peak surface brightness (A = 2970 mJy/arcsec2) is plotted as the upper limit, and the lowest peak surface brightness (E = 980 mJy/arcsec2) is plotted as the lower limit. |
The possible attenuation of radio emission at 1.4 GHz by thermal absorption was mentioned by Sakamoto et al. (2013). Instead of using the measured 1.4 GHz flux density, they extrapolated the total 26.1 mJy obtained by Baan & Klöckner (2006), using the VLA at 4.8 GHz, down to 1.4 GHz (using α = −0.8 typical for synchrotron radiation) assuming that the 4.8 GHz emission was not as severely affected by thermal absorption. They derived a star formation rate (SFR) of 9 M⊙ yr-1, still too low compared to what is derived from IR, but if the starburst is unusually dense we could get significant thermal absorption even at 5 GHz. Could thermal absorption explain the low radio-emission from NGC 4418?
To model the effect of thermal absorption we use theoretical spectra for a star forming galaxy using the model of well-mixed thermal/non-thermal emission by Condon et al. (1991) (see Fig. 5). The successive curves are given by the equation ![Mathematical equation: \begin{equation} S_\nu= \left(\frac{\nu}{8.4}\right)^2\cdot 10^{-1.3} \cdot T_{\rm e} \cdot \left(1-{\rm e}^{-\tau}\right) \cdot\left[1+10\left(\frac{\nu}{1~\mathrm{GHz}}\right)^{(0.1+\alpha)}\right], \label{eqn:condonmodel} \end{equation}](/articles/aa/full_html/2014/06/aa23303-13/aa23303-13-eq163.png) (1)where Sν is the surface brightness in mJy/arcsec2, Te = 104 K is the thermal electron temperature, α = −0.8 is the typical synchrotron radiation spectral index, and νc is the turn over frequency where the free-free optical depth τ = (ν/νc)-2.1 = 1.
(1)where Sν is the surface brightness in mJy/arcsec2, Te = 104 K is the thermal electron temperature, α = −0.8 is the typical synchrotron radiation spectral index, and νc is the turn over frequency where the free-free optical depth τ = (ν/νc)-2.1 = 1.
Bell (2003) gives the relation between the star formation rate and the observed 1.4 GHz radio luminosity as ![Mathematical equation: \begin{equation} \mathit{SFR}[M_{\sun}~\mathrm{yr}^{-1}] = 5.52\,\times\, 10^{-22} \cdot L_{1.4}[\mathrm{W/Hz}]. \end{equation}](/articles/aa/full_html/2014/06/aa23303-13/aa23303-13-eq169.png) (2)Dividing this equation by 1 kpc2 to get surface brightness, we can relate turn-over frequency νc in Eq. (1) at 1.4 GHz to the optically thin part of the spectra in Fig. 5 (τ ≪ 1 in Eq. (1)) as
(2)Dividing this equation by 1 kpc2 to get surface brightness, we can relate turn-over frequency νc in Eq. (1) at 1.4 GHz to the optically thin part of the spectra in Fig. 5 (τ ≪ 1 in Eq. (1)) as ![Mathematical equation: \begin{equation} {\it SFR}[M_{\sun}~\mathrm{yr}^{-1}~\mathrm{kpc^{-2}]}\approx172\cdot\left(\frac{\nu_{\rm c}}{\text{GHz}}\right)^{2.1}\cdot \label{eqn:nuctosfr} \end{equation}](/articles/aa/full_html/2014/06/aa23303-13/aa23303-13-eq172.png) (3)The average surface brightness of the resolved features A, B, C, D, E, and H can be estimated as the fitted integrated flux density divided by the total area. Using Eq. (4) in Condon et al. (1991) and the sizes from Table 2, we get a total area of 7700 mas2 and a total integrated flux density of 19.8 mJy, i.e. an average surface brightness of 2600 mJy/arcsec2. Figure 5 shows this average surface brightness of features A, B, C, D, E, and H together with theoretical spectra. The highest peak surface brightness (A = 2970 mJy/arcsec2) is plotted as the upper limit, and the lowest peak surface brightness (E = 980 mJy/arcsec2) is plotted as the lower limit.
(3)The average surface brightness of the resolved features A, B, C, D, E, and H can be estimated as the fitted integrated flux density divided by the total area. Using Eq. (4) in Condon et al. (1991) and the sizes from Table 2, we get a total area of 7700 mas2 and a total integrated flux density of 19.8 mJy, i.e. an average surface brightness of 2600 mJy/arcsec2. Figure 5 shows this average surface brightness of features A, B, C, D, E, and H together with theoretical spectra. The highest peak surface brightness (A = 2970 mJy/arcsec2) is plotted as the upper limit, and the lowest peak surface brightness (E = 980 mJy/arcsec2) is plotted as the lower limit.
The average surface brightness of NGC 4418 falls above the theoretical limit in Fig. 5, but on parsec scales the interstellar medium might be clumpy and the emission not as well mixed as assumed by this model. Condon et al. (1991) note that “inhomogeneities in real sources will produce spectral peaks somewhat broader than those plotted”. This could explain the peak brightness of the detected features being up to a factor of three above the model. Another explanation could be if one of the strongest features is due to AGN activity, e.g. feature A, while the rest of the radio emission is due to star formation. Unfortunately, the current data do not allow us to clearly separate any AGN components from the other compact features.
If the features detected in Fig. 2 are clusters of star formation described by the model in Fig. 5, the frequency where the free-free optical depth τ = 1 would be close to the upper two curves in Fig. 5 and we estimate an average star formation rate per area from Eq. (3) as 104.5−105.5M⊙ yr-1 kpc-2. Multiplying by the area of 208 pc2 for the resolved components A, B, C, D, E, and H, we estimate the total star formation rate to be 7−70 M⊙yr-1 in the nucleus of NGC 4418 (possibly even higher if including the unresolved regions F and G as well). This is consistent with previous estimates of 30–100 M⊙ yr-1 by Sakamoto et al. (2013, their Fig. 17) using Starburst 99 for an instantaneous starburst of age 1−3 Myr, L/M = 103 L⊙/M⊙. Hence the low ratio of radio/FIR emission might be due to free-free absorption affecting radio emission not only at 1.4 GHz but also at 5.0 GHz. The above free-free absorption model also has the advantage that it naturally explains the observed inverted spectrum of the nucleus.
6. Summary and conclusions
Eight compact features have been detected in the nucleus of NGC 4418 at 5.0 GHz. The complex morphology and inverted spectrum of the compact features can be seen as evidence against the hypothesis that an AGN alone is powering the nucleus of NGC 4418. This indicates a significant contribution from star
formation. The compact features can be super star clusters with intense star formation. We note, however, that the surface brightness of the compact features is close to the limit of what can be produced by well-mixed thermal/non-thermal emission from any surface density of star formation. This could be due to an AGN responsible for some of the radio emission while the rest is due to star formation. Unfortunately, the current data does not allow us to clearly separate an AGN feature from features due to star formation.
New multi frequency radio VLBI observations with the current capabilities of EVN and eMERLIN are planned in 2014. We hope that these will further constrain the nature of the compact features in the nucleus of NGC 4418.
Acknowledgments
E.V., J.C., S.A., and I.M.-V. all acknowledge support from the Swedish research council. The European VLBI Network (EVN) is a joint facility of European, Chinese, South African and other radio astronomy institutes funded by their national research councils. MERLIN/eMERLIN is a National Facility operated by the University of Manchester at Jodrell Bank Observatory on behalf of STFC. The research leading to these results has received funding from the European Commission Seventh Framework Programme (FP/2007−2013) under grant agreement No. 283393 (RadioNet3).
References
- Armus, L., Heckman, T. M., & Miley, G. K. 1988, ApJ, 326, L45 [NASA ADS] [CrossRef] [Google Scholar]
- Armus, L., Heckman, T. M., & Miley, G. K. 1989, ApJ, 347, 727 [NASA ADS] [CrossRef] [Google Scholar]
- Baan, W. A., & Klöckner, H.-R. 2006, A&A, 449, 559 [NASA ADS] [CrossRef] [EDP Sciences] [Google Scholar]
- Batejat, F., Conway, J. E., Hurley, R., et al. 2011, ApJ, 740, 95 [NASA ADS] [CrossRef] [Google Scholar]
- Bell, E. F. 2003, ApJ, 586, 794 [Google Scholar]
- Bondi, M., Pérez-Torres, M. A., Herrero-Illana, R., & Alberdi, A. 2012, A&A, 539, A134 [NASA ADS] [CrossRef] [EDP Sciences] [Google Scholar]
- Briggs, D. S. 1995, Ph.D. Thesis, The New Mexico Institute of Mining and Technology, USA [Google Scholar]
- Condon, J. J. 1992, ARA&A, 30, 575 [NASA ADS] [CrossRef] [MathSciNet] [Google Scholar]
- Condon, J. J., Helou, G., Sanders, D. B., & Soifer, B. T. 1990, ApJS, 73, 359 [NASA ADS] [CrossRef] [Google Scholar]
- Condon, J. J., Huang, Z.-P., Yin, Q. F., & Thuan, T. X. 1991, ApJ, 378, 65 [NASA ADS] [CrossRef] [Google Scholar]
- Costagliola, F., Aalto, S., Sakamoto, K., et al. 2013, A&A, 556, A66 [Google Scholar]
- Evans, A. S., Becklin, E. E., Scoville, N. Z., et al. 2003, AJ, 125, 2341 [NASA ADS] [CrossRef] [Google Scholar]
- Gallimore, J. F., & Beswick, R. 2004, AJ, 127, 239 [NASA ADS] [CrossRef] [Google Scholar]
- Gallimore, J. F., Baum, S. A., & O’Dea, C. P. 1996, in AAS Meeting Abstracts, 109.05, BAAS, 28, 1421 [NASA ADS] [Google Scholar]
- González-Alfonso, E., Fischer, J., Graciá-Carpio, J., et al. 2012, A&A, 541, A4 [NASA ADS] [CrossRef] [EDP Sciences] [Google Scholar]
- Greisen, E. W. 2003, Information Handling in Astronomy – Historical Vistas, Astrophys. Space Sci. Lib., 285, 109 [NASA ADS] [CrossRef] [Google Scholar]
- Jones, D. L., Wehrle, A. E., Piner, B. G., & Meier, D. L. 2001, ApJ, 553, 968 [NASA ADS] [CrossRef] [Google Scholar]
- Kettenis, M., van Langevelde, H. J., Reynolds, C., & Cotton, B. 2006, in Astronomical Data Analysis Software and Systems XV, eds. C. Gabriel, C. Arviset, D. Ponz, & S. Enrique, ASP Conf. Ser., 351, 497 [Google Scholar]
- Maiolino, R., Comastri, A., Gilli, R., et al. 2003, MNRAS, 344, L59 [NASA ADS] [CrossRef] [Google Scholar]
- McMullin, J. P., Waters, B., Schiebel, D., Young, W., & Golap, K. 2007, in Astronomical Data Analysis Software and Systems XVI, eds. R. A. Shaw, F. Hill, & D. J. Bell, ASP Conf. Ser., 376, 127 [Google Scholar]
- Murray, N. 2009, ApJ, 691, 946 [NASA ADS] [CrossRef] [Google Scholar]
- Östlin, G., Cumming, R. J., & Bergvall, N. 2007, A&A, 461, 471 [NASA ADS] [CrossRef] [EDP Sciences] [Google Scholar]
- Perucho, M., Martí-Vidal, I., Lobanov, A. P., & Hardee, P. E. 2012, A&A, 545, A65 [NASA ADS] [CrossRef] [EDP Sciences] [Google Scholar]
- Roche, P. F., Aitken, D. K., Smith, C. H., & James, S. D. 1986, MNRAS, 218, 19P [NASA ADS] [CrossRef] [Google Scholar]
- Roussel, H., Helou, G., Beck, R., et al. 2003, ApJ, 593, 733 [Google Scholar]
- Sakamoto, K., Aalto, S., Costagliola, F., et al. 2013, ApJ, 764, 42 [NASA ADS] [CrossRef] [Google Scholar]
- Scoville, N. 2003, J. Korean Astron. Soc., 36, 167 [NASA ADS] [CrossRef] [Google Scholar]
- Shepherd, M. C. 1997, in Astronomical Data Analysis Software and Systems VI, eds. G. Hunt, & H. Payne, ASP Conf. Ser., 125, 77 [Google Scholar]
- Spoon, H. W. W., Keane, J. V., Tielens, A. G. G. M., Lutz, D., & Moorwood, A. F. M. 2001, A&A, 365, L353 [NASA ADS] [CrossRef] [EDP Sciences] [Google Scholar]
- Thompson, A. R., Moran, J. M., & Swenson, G. W. 2001, Interferometry and Synthesis in Radio Astronomy, 2nd edn. (Weinheim: Wiley-VCH) [Google Scholar]
- Thompson, T. A., Quataert, E., & Murray, N. 2005, ApJ, 630, 167 [NASA ADS] [CrossRef] [Google Scholar]
- Wilson, T. L., Rohlfs, K., & Hüttemeister, S. 2009, Tools of Radio Astronomy (Springer-Verlag) [Google Scholar]
- Yun, M. S., Reddy, N. A., & Condon, J. J. 2001, ApJ, 554, 803 [NASA ADS] [CrossRef] [Google Scholar]
All Tables
All Figures
|
Fig. 1 MERLIN-only continuum image of NGC 4418 at 5.0 GHz. Contour levels are (−2,2,4,6,8,10,12,14,16,18,20,22,24,26,28) times the noise root mean square (rms) σ = 300 μJy/beam. We note that there are no negative features as strong as − 2σ, hence no dashed contours. The CLEAN restoring PSF of FWHM 105 mas×42 mas is plotted in the lower left inset. The labels A–H mark the positions of the compact features seen in Fig. 2. The label S (close to label C) corresponds to the 860 μm continuum peak position from Sakamoto et al. (2013). |
| In the text | |
|
Fig. 2 EVN and MERLIN 5 GHz image of NGC 4418 with relative weight 1.0 between the EVN and MERLIN data. The contour levels are (−2,2,4,6,8,10,12,14,16) times the rms noise of σ = 90 μJy/beam. Eight compact features are visible above 5σ labelled from A to H. The label S (close to label C) corresponds to the 860 μm continuum peak position from Sakamoto et al. (2013). The CLEAN restoring PSF of FWHM 20.6 mas×14.8 mas is plotted in the lower left corner. |
| In the text | |
|
Fig. 3 Coverage of the Fourier plane for the EVN data, plotted as V vs. U in units of Mλ. The discrete set of spatial scales sampled in delineation is mainly due to the small (close to 0) declination of NGC 4418. The concatenation of the MERLIN data adds shorter baselines in the centre of less than about 3 Mλ. |
| In the text | |
|
Fig. 4 5 GHz EVN and MERLIN images of NGC 4418 with different relative weighting. In a) the weight of the EVN is increased by a factor of ten with respect to MERLIN. As expected, the features F and G are still prominent, but the features A, B, C, D, E, and H are weaker. In b) the weights of MERLIN data are increased by a factor of ten with respect to the EVN. F and G are now lost in the noise, but we still see A, B, C, D, E, and H. The noise rms increases to 95 μJy/beam for panel a) and 150 μJy/beam for b). For easy comparison the contours in panels a) and b) have been set to the same (−2,2,4,6,8,10,12,14,16) times 90 μJy as in Fig. 2. |
| In the text | |
|
Fig. 5 Radio brightness spectra for star formation powered radio emission based on the mixed synchrotron/thermal model of Condon et al. (1991) (see Eq. (1)) assuming a 10% free-free emission contribution at 1.4 GHz. Successive curves correspond to increasing the frequency at which the free-free optical depth is τ = 1 which, using Eq. (3), translates to successive curves of star formation rate density: 10-3, 10-2, 10-1, 100, 101, 102, 103, 104, and 105 [ M⊙ yr-1 kpc-2 ]. The average surface brightness of the resolved features A, B, C, D, E, and H detected at 5.0 GHz in Fig. 2 is marked with a star. The highest peak surface brightness (A = 2970 mJy/arcsec2) is plotted as the upper limit, and the lowest peak surface brightness (E = 980 mJy/arcsec2) is plotted as the lower limit. |
| In the text | |
Current usage metrics show cumulative count of Article Views (full-text article views including HTML views, PDF and ePub downloads, according to the available data) and Abstracts Views on Vision4Press platform.
Data correspond to usage on the plateform after 2015. The current usage metrics is available 48-96 hours after online publication and is updated daily on week days.
Initial download of the metrics may take a while.