Fig. 5
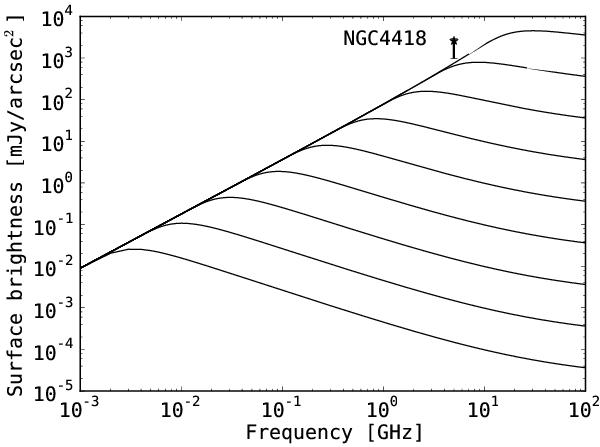
Radio brightness spectra for star formation powered radio emission based on the mixed synchrotron/thermal model of Condon et al. (1991) (see Eq. (1)) assuming a 10% free-free emission contribution at 1.4 GHz. Successive curves correspond to increasing the frequency at which the free-free optical depth is τ = 1 which, using Eq. (3), translates to successive curves of star formation rate density: 10-3, 10-2, 10-1, 100, 101, 102, 103, 104, and 105 [ M⊙ yr-1 kpc-2 ]. The average surface brightness of the resolved features A, B, C, D, E, and H detected at 5.0 GHz in Fig. 2 is marked with a star. The highest peak surface brightness (A = 2970 mJy/arcsec2) is plotted as the upper limit, and the lowest peak surface brightness (E = 980 mJy/arcsec2) is plotted as the lower limit.
Current usage metrics show cumulative count of Article Views (full-text article views including HTML views, PDF and ePub downloads, according to the available data) and Abstracts Views on Vision4Press platform.
Data correspond to usage on the plateform after 2015. The current usage metrics is available 48-96 hours after online publication and is updated daily on week days.
Initial download of the metrics may take a while.